In this continuing series, I’m blogging about Free tools for SQL Server DBAs. You can check the whole series out, here. This week we’re talking about and old standard – SQL Sentry Plan Explorer.
SQL Sentry Plan Explorer
I hope you look at SQL Server execution plans. If you do this in management studio using the graphical plans, you’ve probably been frustrated before. Scrolling around trying to see it all, asking yourself “is that cost by CPU? Or cost by IO?”, you’ve bee confused by some of the missing index suggestions and you’ve missed some things if you’ve never looked at the properties window.
What if you could use a free tool to just remove those obstacles? Well you can. SQL Sentry is one of the find vendors out there making software to help DBAs monitor their SQL Servers. It’s one of the two performance monitoring tools I prefer to use with my clients and, for full disclosure, I’ve been on their product advisory council. Several years ago, they decided they wanted to make a tool to better visualize query plans. They wanted to fix those challenges I described.
Enter SQL Sentry’s Free Plan Explorer. You can read about it or just download it here on their site. SQL Sentry has a few SQL Server MVPs on their team, and even more that are MVP quality people who aren’t named. Plan Explorer is an amazing free resource and I commend Greg and his team for building this and maintaining it over the years.
This is one of the free tools that I use on all of my machines and use all the time. I hate tuning queries without plan explorer, in fact.
Why Plan Explorer?
On the left of this text is an image of a relatively simple plan from the adventure works database in SQL Server Management Studio. On the right is an example from SQL Sentry Plan Explorer of the same plan.
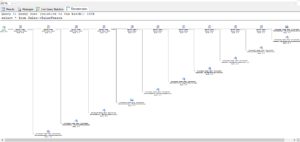
In the free version (which is what I’ve pictured here), you can do many things to your query plan view. You can right click and change the costing to display costs cumulatively or per individual node/operator/step on the query plan. You can change the costing to be the default (CPU+I/O) to just CPU or just IO depending on what you are trying to track down and solve as you go. You can change to show actual costs instead of estimated. You can expand expressions. You can change the line width to move from row size to data size, also. Even the tool tip window from hovering over an operator shows more detailed data
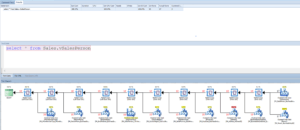
and shows it to in a more helpful way.
There are other tabs available as well. You can see the plan tree. You can see the join diagram. And the top operations. This table shows operations and easily shows you the actuals vs estimated so you can see when those don’t line up.
So that’s why. It’s a great tool. Add to that:
- Just download and use – quick and easy installer, no e-mail address or sign up needed
- Can use as an Add-In to SSMS – of course this add in really just opens Plan Explorer but that’s still where I’d rather be.
Thank the folks over there for their free DBA Tool! See you next week.