
Quick Summary
After patching the secondary node of a two-node SQL Server Availability Group, the secondary databases stopped showing as part of the AG entirely, without errors, even though normally an issue would be indicated by the databases reporting an unhealthy state. Was there a patching error? A configuration problem? Something worse? We pulled up sp_CheckAG and started working through it systematically to find out.
Context
We were performing routine patching on the secondary node of a SQL Server 2019 Availability Group. The plan was simple: patch the secondary first since it was carrying no primary workload, restart the instance, verify, and move on.
The Problem
After applying the patch and restarting the secondary node, the secondary databases were no longer showing as part of the AG. There were no errors reported within SQL Server, and the primary AG node still showed all green.
The Investigation
The first tool we reached for was sp_CheckAG, our free community tool for inventorying and troubleshooting SQL Server Availability Groups. Running it in Mode 1 gave an immediate overview: instance info, cluster state, cluster members, endpoint status, and AG configuration, all in one place without having to bounce between SSMS Object Explorer, Failover Cluster Manager, and system DMVs.
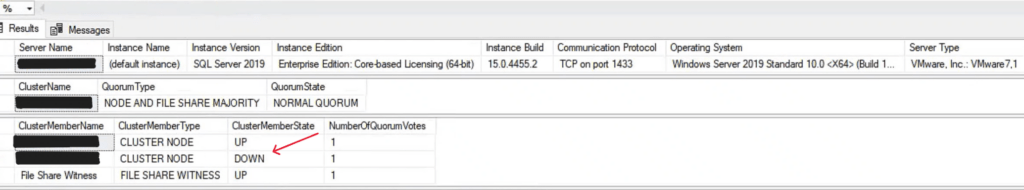
The output showed clearly that a cluster node was in a DOWN state. The AG role couldn’t come online because the cluster itself hadn’t come back online successfully. We dumped the Cluster Log to check for errors that might explain why the node was lagging. Nothing stood out in the log as a clear failure. No errors pointing to a misconfiguration or a service crash. Just a node that was taking its time.
About 30 minutes after the initial restart, the cluster node came back online, the AG role came up with it, and the secondary databases rejoined the AG on their own. The issue resolved without any manual intervention.
The post-incident review pointed toward a network connector on the cluster node that had caused the delay in the cluster role coming back online. The connector wasn’t throwing hard errors in the log, which is exactly the kind of subtle hardware issue that can make post-patching troubleshooting feel like chasing a ghost.
The Fix
In this case, the fix was largely a matter of accurate diagnosis and patience. Once sp_CheckAG showed that the cluster node itself was DOWN, the troubleshooting path narrowed quickly. We weren’t looking at an AG configuration problem or a SQL Server issue. We were looking at a cluster problem, and specifically, one that ended up resolving on its own.
Lesson/Takeaway
Post-patching issues on AG nodes don’t always mean something went wrong with the patch. Sometimes the cluster itself needs a few extra minutes, and that delay can surface as what looks like a more serious AG problem.
A few things worth taking away from this case:
- Check the cluster before assuming a direct AG issue. When issues occur after a node restart, the AG is often a symptom, not the cause. Check the cluster state first. sp_CheckAG gives us a fast way to get that full picture in one output.
- Hardware can cause intermittent, hard-to-catch issues. A bad network connector won’t always generate obvious errors. If your cluster is slow to recover after a restart, don’t overlook the physical layer.
- The Cluster Log is your friend, even when it’s quiet. We dumped the Cluster Log as part of troubleshooting. It didn’t show hard errors here, but that negative result was still useful information. It ruled out configuration and service failures and pointed toward something lower in the stack.
The Straight Path Team and Skills
Jack Corbett, our longest-tenured Senior DBA (outside of our founder, Mike Walsh) took the lead in troubleshooting this issue. Knowing where to look first, what to rule out, and how to read cluster and AG health quickly without the noise comes from his years of hands-on work in production environments.
The tool we used here, sp_CheckAG, was built by Jeff Iannucci, one of our Principal Consultants, because we kept wishing a tool like this existed. It’s the same tool our team uses every day for client work. It’s completely free and available on our Straight Path GitHub.
We also maintain sp_CheckSecurity, sp_CheckBackup, and sp_checkTempdb as part of the same community toolset. These are the actual tools we use in our day-to-day client work, made available to the community.
This post is part of our Case of the Week series—real SQL Server issues and lessons from the field.
If you are inheriting SQL Server environments and want a team that knows how to dig into the details, reach out to us, and let’s talk about managing your SQL Server environment together. Our team is 20 people deep, and we have MVPs, speakers, bloggers, and authors. We know a lot because we’ve been exposed to a lot.