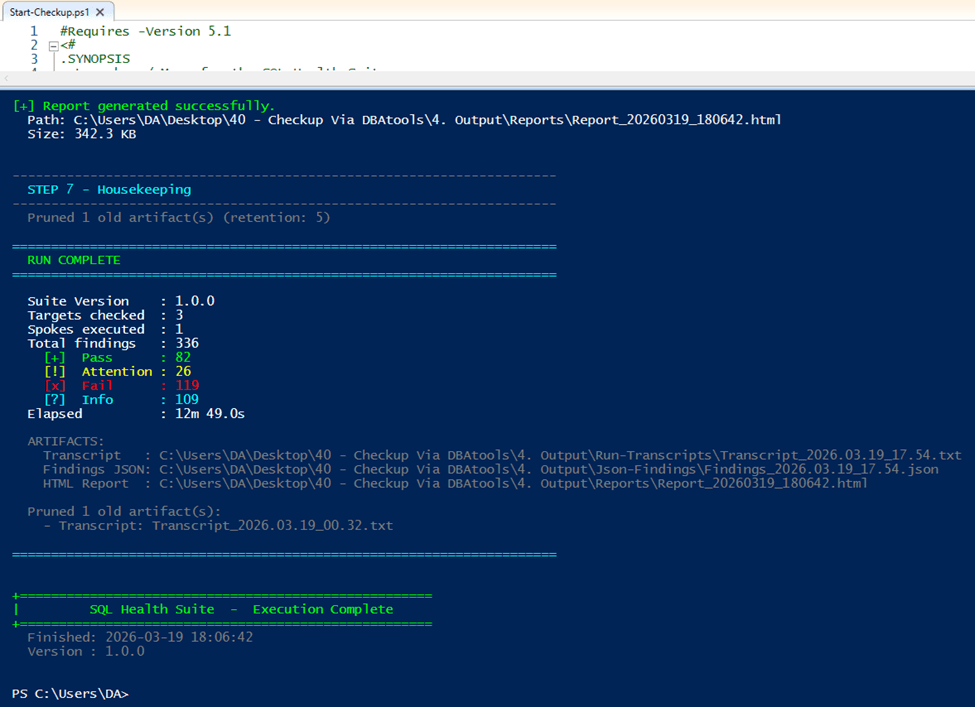
After a longer break than expected, I am back to the dbatools for SQL Server DBAs blog series, and this one is a monster! In fact, this project is so big that I think it will be better to release it incrementally. This will allow you clone the repository, test and modify it in your own environment and come back for free updates over the weeks/ months to come. It is designed to allow you to customize it to your environment’s needs. This first post will be the initial process overview as well as the first set of checks and how to navigate the report.
My goal was to grab every dbatools discovery command I could find and shape it into a usable health check for you to use. There are 700 dbatools commands, and portion of that is geared for discovery and testing. I did not include every possible command and as you can imagine there are a lot of moving parts. I’ve got it in a good state for you to take, look at, modify, and make your own. This is the dbatools powered checkup that made sense to me, I hope it is useful and exciting for you!
You can access all the source code and follow along in this post and the subsequent posts walking through this on our github. Like our family of sp_check* community tools, this is free for you to explore, understand, and use to improve your own environment.
Boilerplate
As a reminder, I created a multi-subnet lab with three developer edition SQL Server instances, one SQL Express and a network share based on this blog post by Jonathan Kehayias. I will likely need to rebuild it after the beating it has taken through this blog series, however that makes it all the more useful for this round. If you are not familiar with dbatools yet, now is the perfect time to grab a test instance and learn! On your test environment you can open PowerShell and run the following scripts. These will install Dbatools and add it to the path for future projects as well as import it into the current session for the purpose of testing the scripts of this blog post.
Install-Module Dbatools

Import-Module Dbatools
The Core Design Principle: Read-Only
This SQL Server Health Check engine is designed to report, not add or change. The star of the show is meant to be DBAtools. I chose many of the GET and TEST cmdlets, some measures, and a few invoke-dbaquery. I will dig into the design and organization for your own testing and review, but this process is meant to read and report within your environment only. Each finding is linked back to the original dbatools function to point out how useful they are in your day-to-day DBA administration and review tasks!
SQL Server Health Check Architecture Overview
The suite follows a clean hub-and-spoke architecture with four layers:
Menu → Engine → Spokes → Output
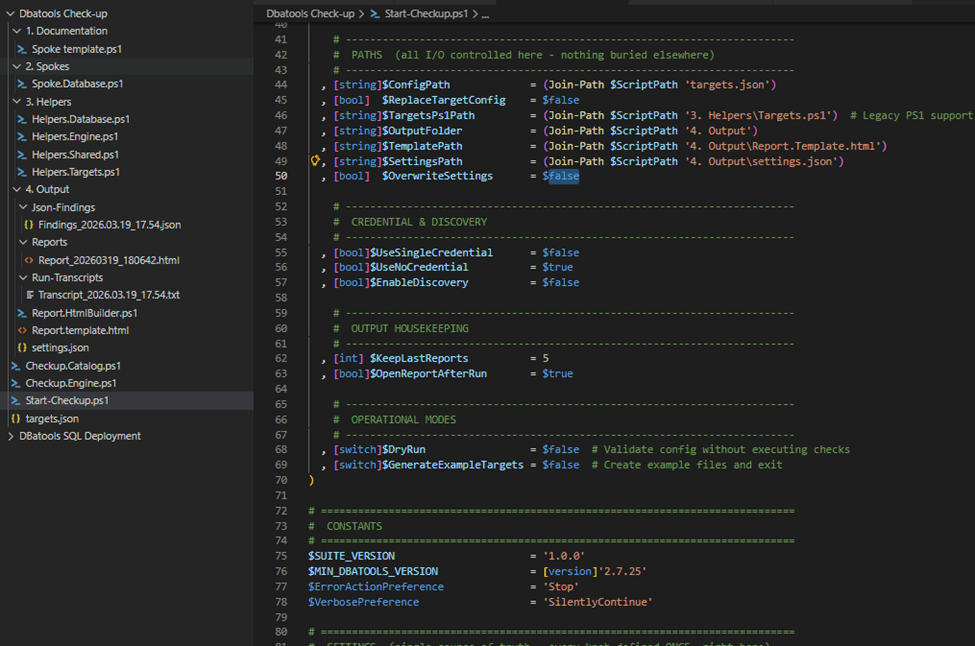
- Start-Checkup.ps1 (Menu): The single entry point. You configure all thresholds, toggles, and paths here — nothing is buried elsewhere. It builds the canonical $Settings hashtable and calls the engine once.
- Checkup.Engine.ps1 (Engine): The orchestrator. It loads targets, discovers check modules, runs each module against each instance, and hands off to the output layer. It contains zero check logic itself.
- Spoke.*.ps1 (Spokes): Individual check packs covering specific domains. Each is self-contained and communicates with the engine through a strict contract — it receives a $Target, a $Config, and a [ref]$Findings list. Nothing else.
- JSON + HTML Output: Findings are first written to a timestamped JSON file (the system of record), then projected into a self-contained HTML report via Report.HtmlBuilder.ps1.
- Checkup.Catalog: The check catalog is the backend check organization tool. Instead of digging though the Spoke files individually to change the priority and category of a check, you can configure both for each check in one place. You can also edit the Label that shows up in the report, if desired.
This separation means you can add a new check pack without touching the engine, update the report template without touching any check logic, and trust that the contracts between layers stay stable.
What DBA Best Practices and Configs are Checked?
It will be a lot. This first iteration will ship with the database spoke. Each pack will be covering many of the areas that matter most in day-to-day SQL Server operations for DBAs. The planned spokes are as follows:
- Instance: Build version currency, startup parameters, sp_configure settings, surface area configuration, error log scanning, and SQL Server Agent status.
- Database ( you are getting this one today!): Backup currency (full, diff, log), VLF counts, auto-growth events, space utilization, anti-pattern detection (Auto-Shrink, Auto-Close), TDE inventory, Query Store status, and owner compliance.
- Maintenance: Last good CHECKDB age, statistics staleness, duplicate/unused/disabled indexes, wait statistics analysis, and identity column capacity.
- HADR: Availability Group health, replica connectivity, log shipping status, and legacy database mirroring.
- Security & Audit: Server-level and database-level audit specifications, SA account status, and surface area exposure.
- TempDB: File count, equal sizing, growth configuration, and space utilization.
- Networking: TCP/IP configuration, named pipes, SPN compliance, static vs. dynamic port, and round-trip latency.
- Host: Power plan compliance, disk space, and OS-level configuration.
- Misc: Database Mail health, Extended Events sessions, and notable trace flags.
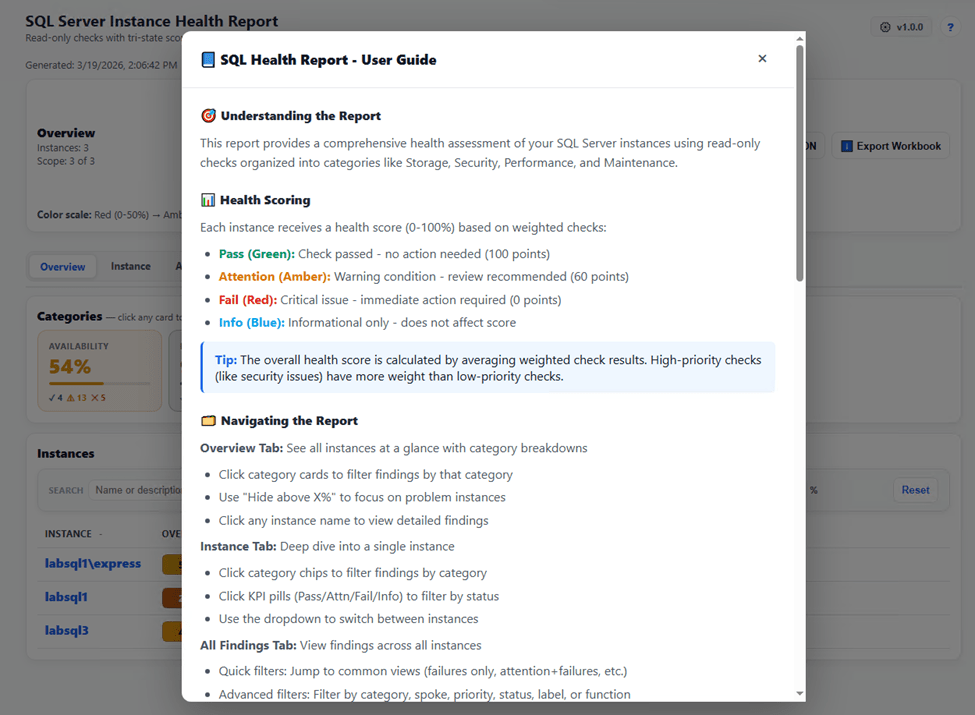
Every check produces one of three actionable statuses — Pass, Attention, or Fail — plus an Informational category for inventory-style output that doesn’t require action.
Scoring and the Health Check Report
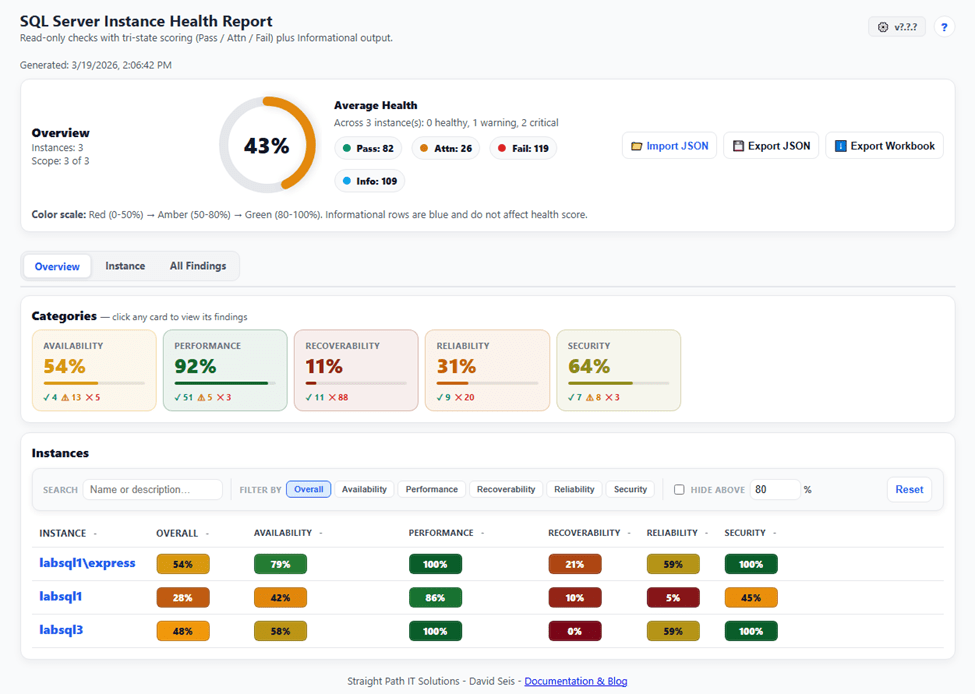
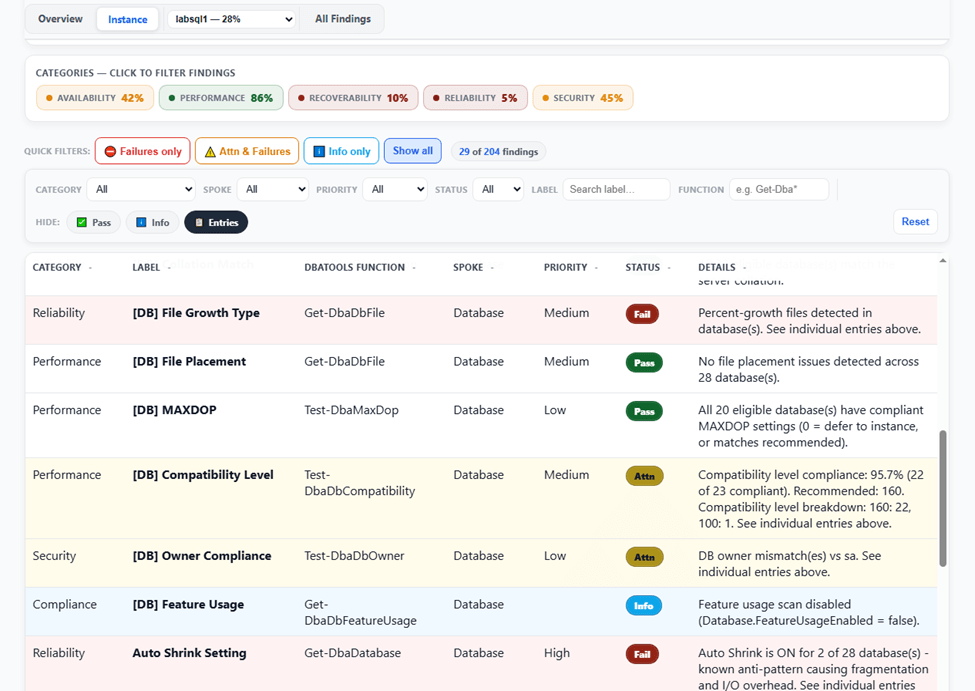
Findings aren’t just a flat list. Each check carries a configurable weight, and scores roll up by category and across the entire instance into a single health percentage — visualized as a gauge in the report header.
We use a similar scoring and multiple category analysis approach in our professional SQL Server scorecard engagements, where we go deeper with expert analysis and a prioritized action plan. We use the same approach with the proactive dashboard we maintain across the 2,000+ SQL Server instances we manage for our more than 120 DBA-as-a-Service clients.
The HTML report is fully self-contained (no external dependencies, no server required). It supports:
- An overview dashboard showing all instances, category breakdowns, and aggregate scores
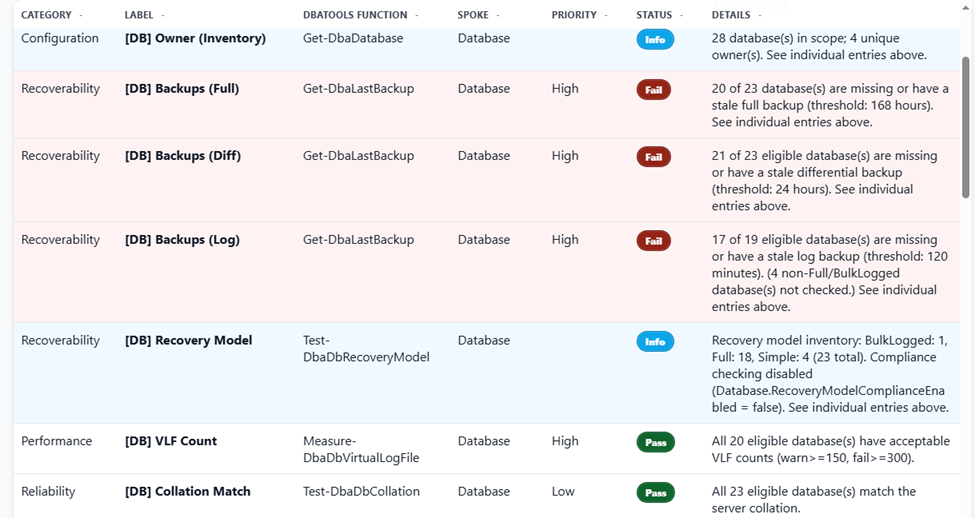
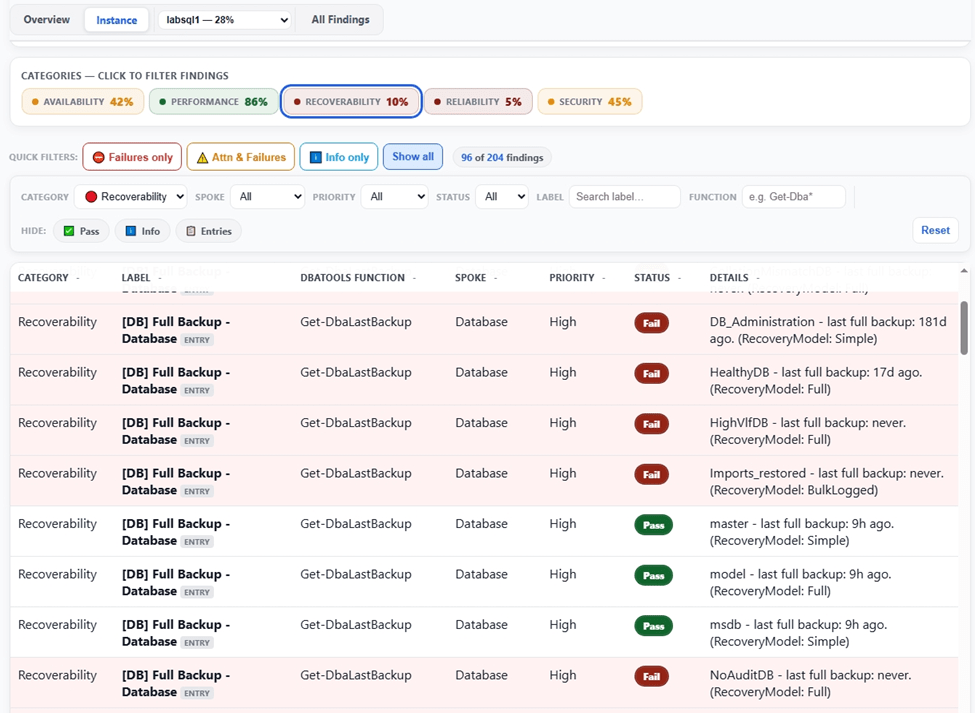
- A drill-down per-instance view with a full findings table
- An all-findings view filterable by status and category
- Import/Export JSON/Excel Workbook buttons for sharing or archiving results
- Sortable tables and color-coded heat cells (red → amber → green)
You can email the HTML file, drop it in a SharePoint, or store it alongside your deployment artifacts — it works anywhere a browser does.
Configuration: Everything in One Place
One of the deliberate design choices is that all configuration lives in a single file: Start-Checkup.ps1. The goal was that there should be no hidden config files, no registry keys, no scattered settings. Every threshold — from the percentage that triggers an identity column warning to whether Named Pipes being enabled is a Fail or just an Attention — is documented inline with a comment explaining the intent.
# Free space thresholds (percent free)
FreeSpacePctAttention = 15.0
FreeSpacePctFail = 5.0
You configure your targets in a Targets.json file, supporting Windows integrated auth, per-target SQL credentials, or a single shared credential for bulk runs.

Get Started Building Your Own SQL Server Health Check and Score Report
Prerequisites are minimal: PowerShell 5.1+ and the dbatools module. The suite uses dbatools exclusively for SQL connectivity — only read-only cmdlets (Get-*, Test-*, Invoke-Dba*Diagnostic*).
- Clone or download the suite to a local folder.
- Edit 3. Helpers\Targets.json to list your SQL Server instances.
- Review thresholds in Start-Checkup.ps1 — the defaults felt reasonable to me, but your environment will have different baseline configurations.
- Run Start-Checkup.ps1 from PowerShell.
- Once completed, the html report will automatically open, otherwise you can open the HTML report from the 4. Output\Reports folder.
- You can export the findings to json (if for some reason you keep the report but not the json result file) or to an excel workbook. The excel workbook has the overview table and the all-findings table. You can also import json if you are wanting to look at a previous run’s data during testing.
The first run will create settings.json from your definitions. Subsequent runs reuse those settings unless you pass -OverwriteSettings. More How-To guides and what to expect will be added to the repo as I release more spokes and as you all have questions. Also, the report has a “?” icon in the top right corner that opens a user guide to help you navigate the report results:
Conclusion
This is not in its final state; in fact, it is meant to be picked up by you and modified to fit your own needs. I worked on this for longer than I ever expected, and there is more I would do if I had the time. With so many moving parts, I can guarantee you that something has been overlooked.
Please take a look at it, respond here, or log bugs on GitHub if you notice any problems.
Look to our blog here or subscribe to our newsletter to find out when I drop the next posts, when I will be back with the additional spokes I promised above, and will let you all know about the updates we make periodically in response to bug fixes.
Hopefully, in just a few months, this will be an awesome health-check tool for you to keep tabs on your environment, featuring dbatools!