Featured image photo by alexey turenkov on Unsplash
A client reached out for help with a performance problem that had been going on for over a day. The application was performing so slowly that it was nearly an outage to their users.
I love working on production emergencies where there’s a severe performance problem. I can often solve them or provide a solution within a few minutes to an hour. Sometimes they take longer when they are complex. Sometimes they take longer because you keep going down the wrong path.
This particular incident had us going down the wrong path because we had not seen this issue before. Once we were on the right path, it was an easy fix!
These were the symptoms that we saw:
- Abnormally high CPU
- Significant THREADPOOL waits
- High HADR_SYNC_COMMIT waits
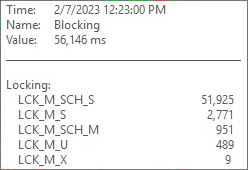
- Moderate LCK* waits
- Low virtual memory condition events
This is what it looked like in SQL Sentry the day before they contacted us:


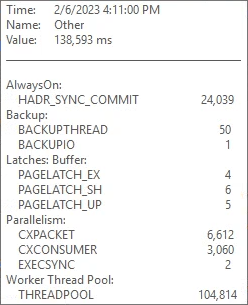
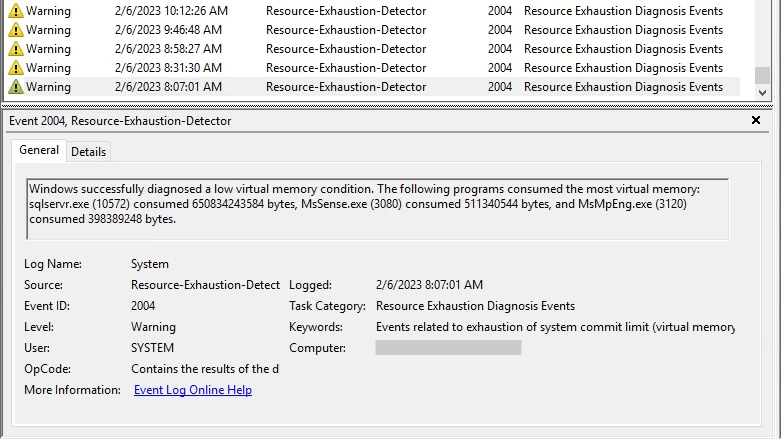
We temporarily switched the Availability Group to asynchronous-commit which obviously eliminated the HADR_SYNC_COMMIT waits, but the users were still complaining about severe slowness.

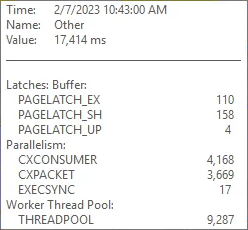

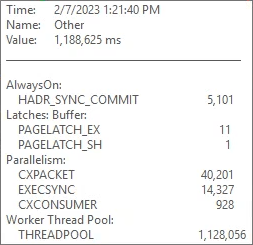
I typically see THREADPOOL waits occurring due to one of the following reasons:
- Severe blocking
- Large number of databases in an Availability Group
- Large number of active sessions
- Bad parameter sniffing, though this is fairly rare
There was blocking timed with most of the THREADPOOL spikes but not all of them. Most of the blocking that was captured was due to IntelliSense and not experienced by the users.
Availability Groups can use a lot of worker threads, but AGs typically only cause THREADPOOL waits when there are hundreds or even thousands of databases. This server only had 33 databases in the AG. We looked into it anyway. By default this server can use up to 701 worker threads as it has 16 processors. We never saw it use more than 300 worker threads when the THREADPOOL waits were happening. This was a clue!
Nothing was making sense.
I said, “Let’s run sp_Blitz so that we can check the server config and see if there is anything weird in there.”
I ran this command and immediately saw concerning issues:
EXEC sp_Blitz @CheckServerInfo = 1, @CheckUserDatabaseObjects = 0

Wait, what?!

sp_Blitz was reporting dangerously low memory at the NUMA node level. It also was reporting that “min server memory” and “max server memory” were set to the same value, which is not recommended. I am not sure why it was set like this.
This server uses a RAM disk for tempdb – again, not sure why. A RAM disk reserves part of memory as a storage drive. This RAM disk was configured to use 175GB of memory. SQL Server was configured to use about 615GB of memory. 615GB + 175GB = 790GB, but there’s only 766GB of RAM on the server. The math doesn’t work!
The RAM disk’s size was increased recently due to tempdb running out of space, but this sent the server over the edge and caused the performance issue.
We lowered “min server memory” and “max server memory” so that the server would have enough memory for SQL Server, the RAM disk and Windows. Suddenly the users were happy! CPU utilization and the waits were back to normal.


We’d have eventually figured out the problem but using sp_Blitz saved us and the client a lot of troubleshooting time.

Great example. Thanks for sharing.
Thanks for sharing this interesting situation. I haven’t encountered threadpool issues before so it is good to know possible solutions.
175GB for TempDB? So was this all one TempDB “file” or 8 @ 20GB, and with a fixed size?
>>We lowered “min server memory” and “max server memory”
maybe you had queries with high memory grants like 25% of buffer pool each