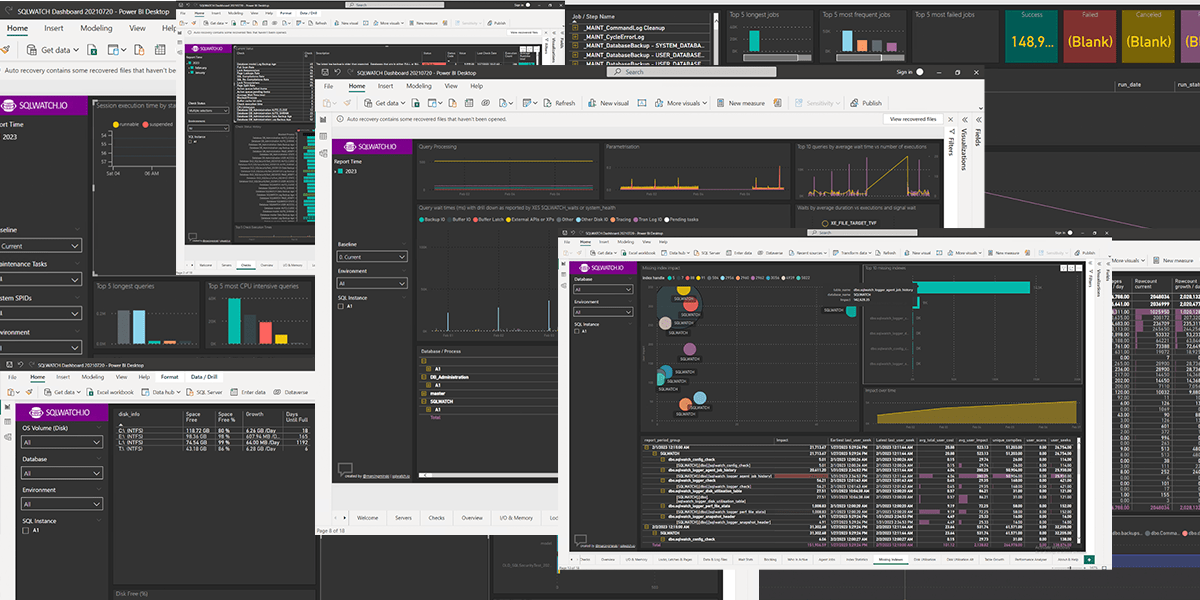
I have been working for Straight Path for a while, and I have grown comfortable with the monitoring tools we use and what we look for on a daily basis. I thought I would branch during our second “Community Tools Month” and try out SQLWatch since it is a free community tool designed to help you monitor your SQL Servers. I was pleasantly surprised by the ease of setup and configuration. While I did not push to the limits of its capabilities, I would like to use this as a platform to recommend trying it out in your own system, especially if you do not already have a tool to help monitor your servers.
Set up
Setting up SQL watch was easy as using a DBAtools command on my test system to point out the target server and database. If you haven’t stepped into the world of DBatools yet, you are missing out! Here is the link for the tool to install https://docs.dbatools.io/Install-DbaSqlWatch. The next step was to connect it to my visualization tool of choice. Since I went the completely free route, I had Grafana or PowerBI desktop as an option. I chose PowerBI desktop, which I got from the Microsoft download center.
Once PowerBI was installed, I opened up the example dashboard and edited the connection to point toward my test instance, and I left both running for 15 days. I edited the parameters to return up to a week of data and pored through the various screens offered. There are ways to have central repositories for multiple servers, which would enrich this tool. I did not set that up this time, but I will continue experimenting with this tool and may have a follow-up post to review that process and experience!
Using SQLwatch
As I mentioned previously, I did not completely stretch the legs of this tool, I am reviewing it as a Jr. DBA who is familiar with the various types of metrics that are frequently used in our consulting and service business. To that end, I was impressed by how quickly I was seeing relevant information with no tweaking. Having no PowerBI experience, I needed it to work out of the box, and to that end I was satisfied. Here are a few of the highlights:
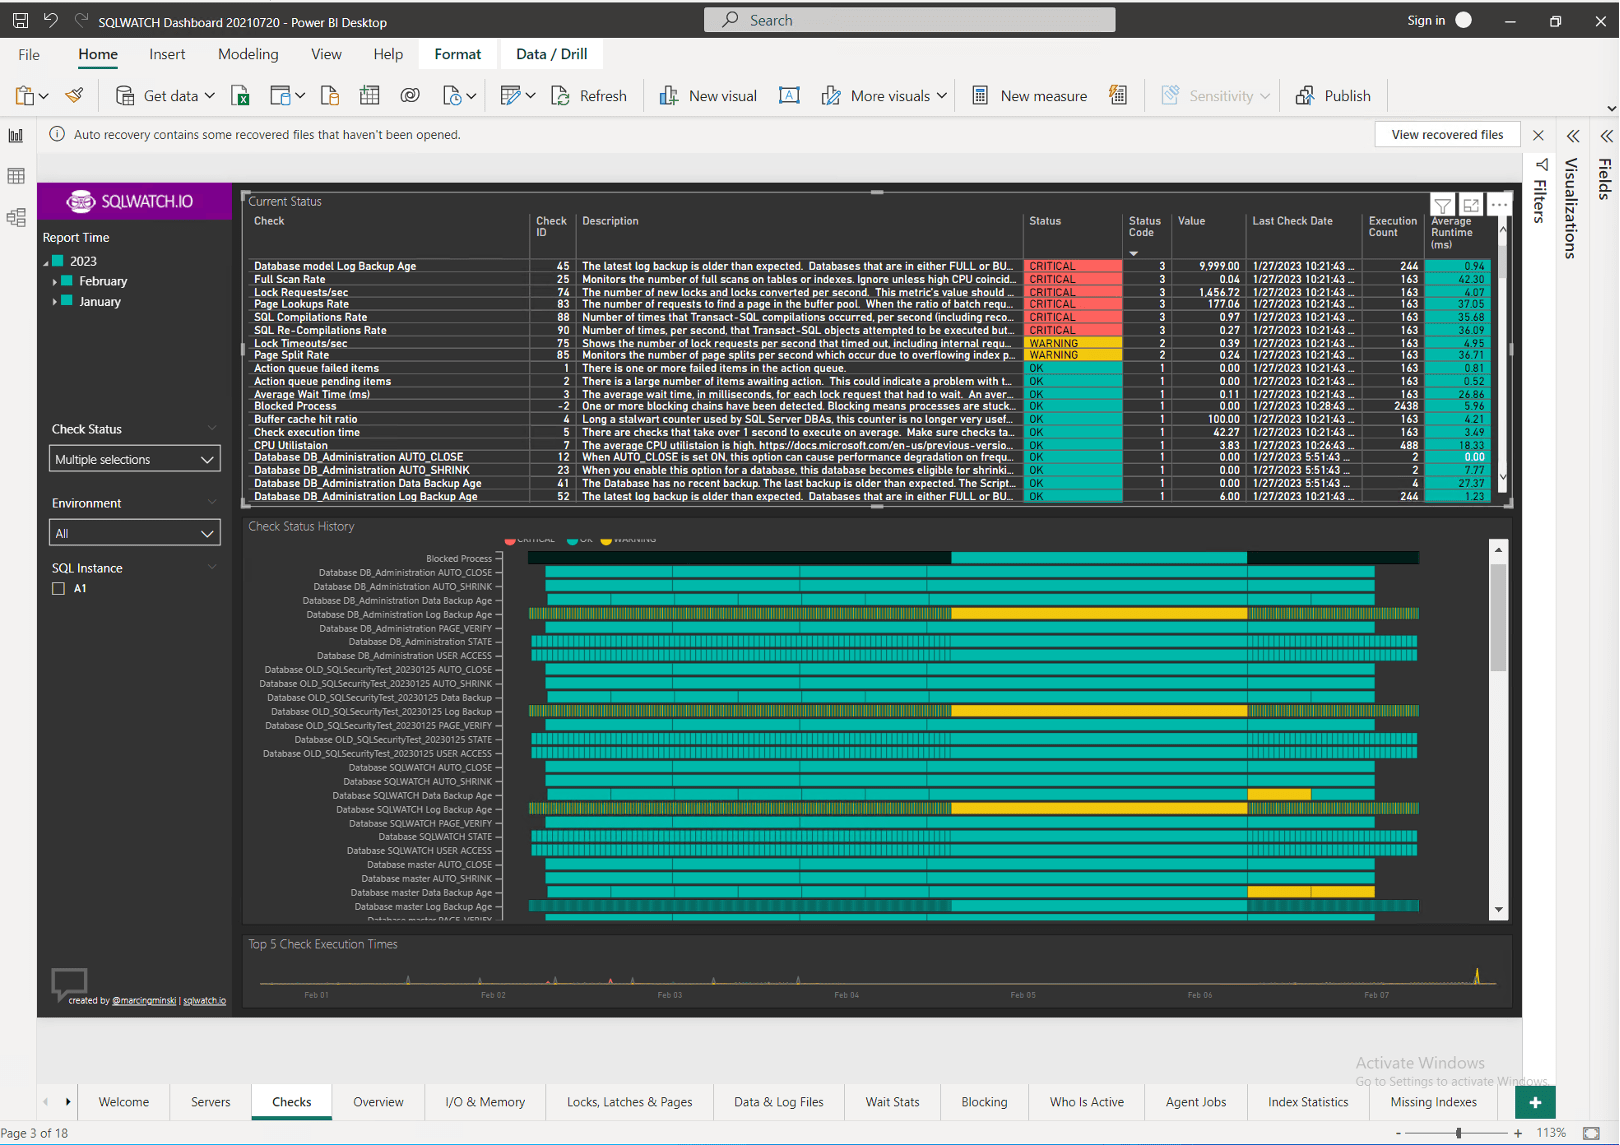
The “Checks” screen had quite a few of the items we check frequently in our daily reports or health checks such as backup age, non-standard or dangerous configurations, and other performance metrics. On each screen, you can pick which instances you are looking at and adjust your time ranges:
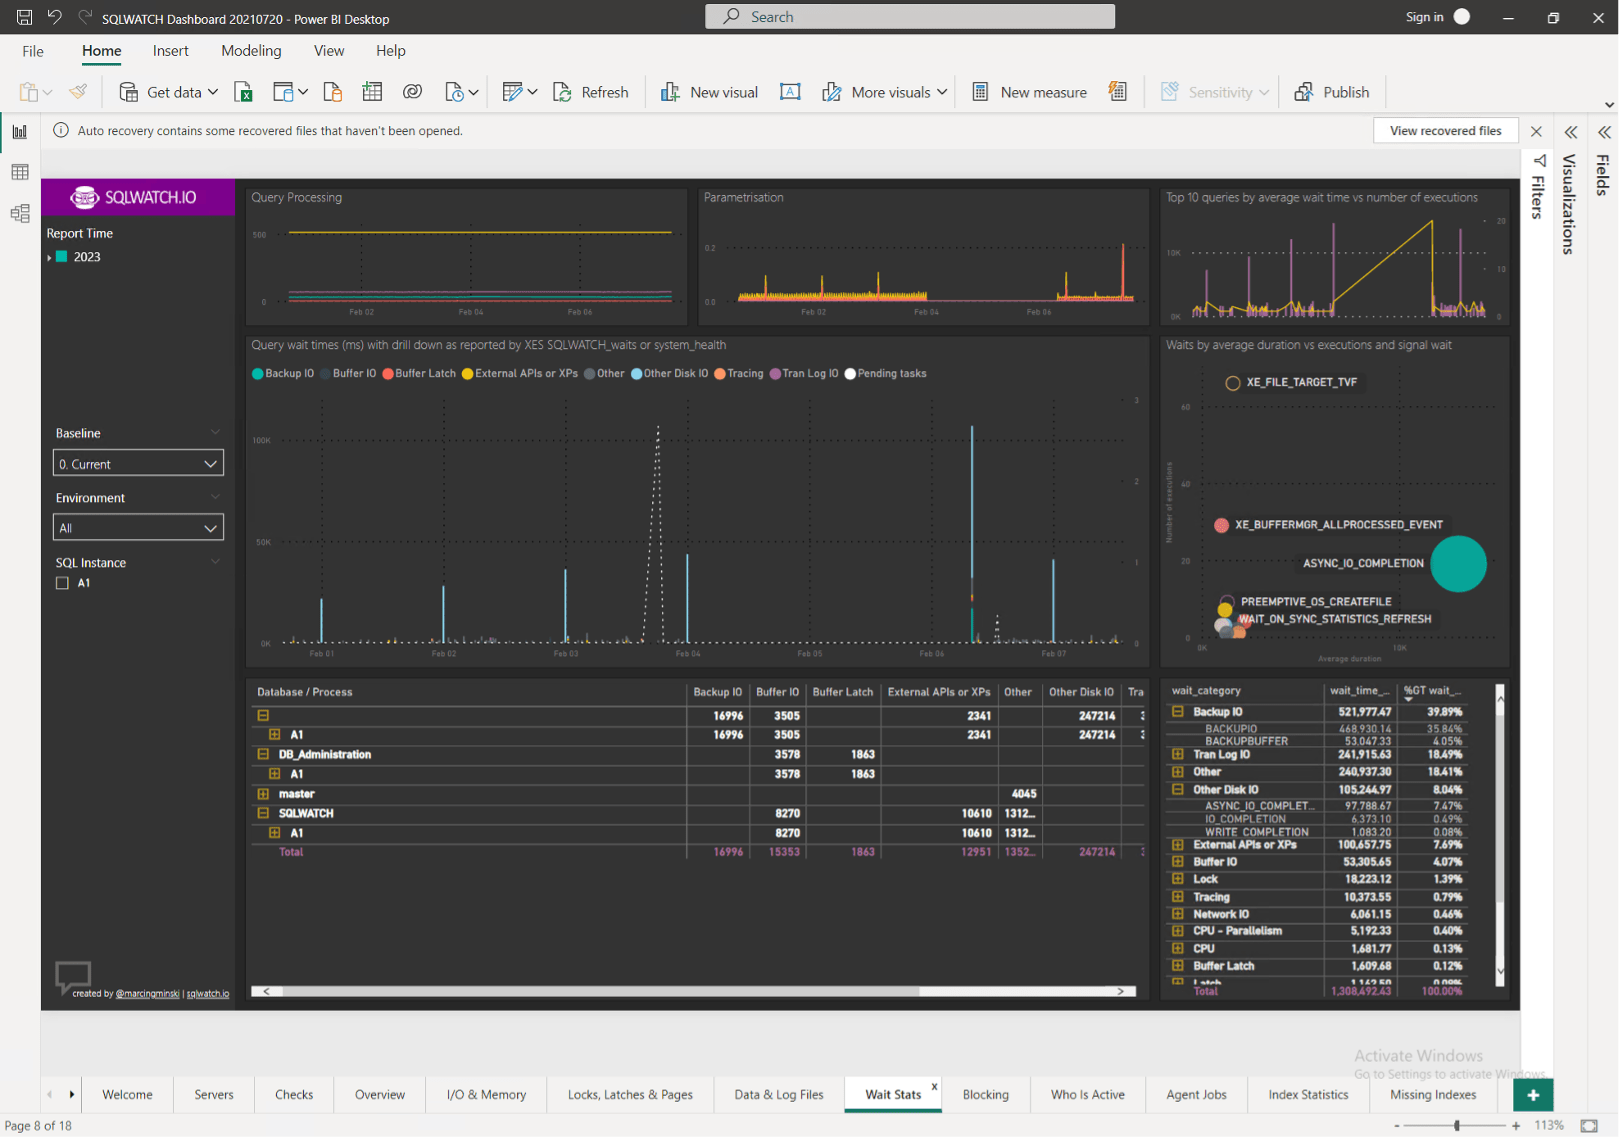
The “Wait Stats” page is also very useful and to me, is like a SQL Sentry-Lite in terms of helping identify performance issues in combination with some of the other pages:
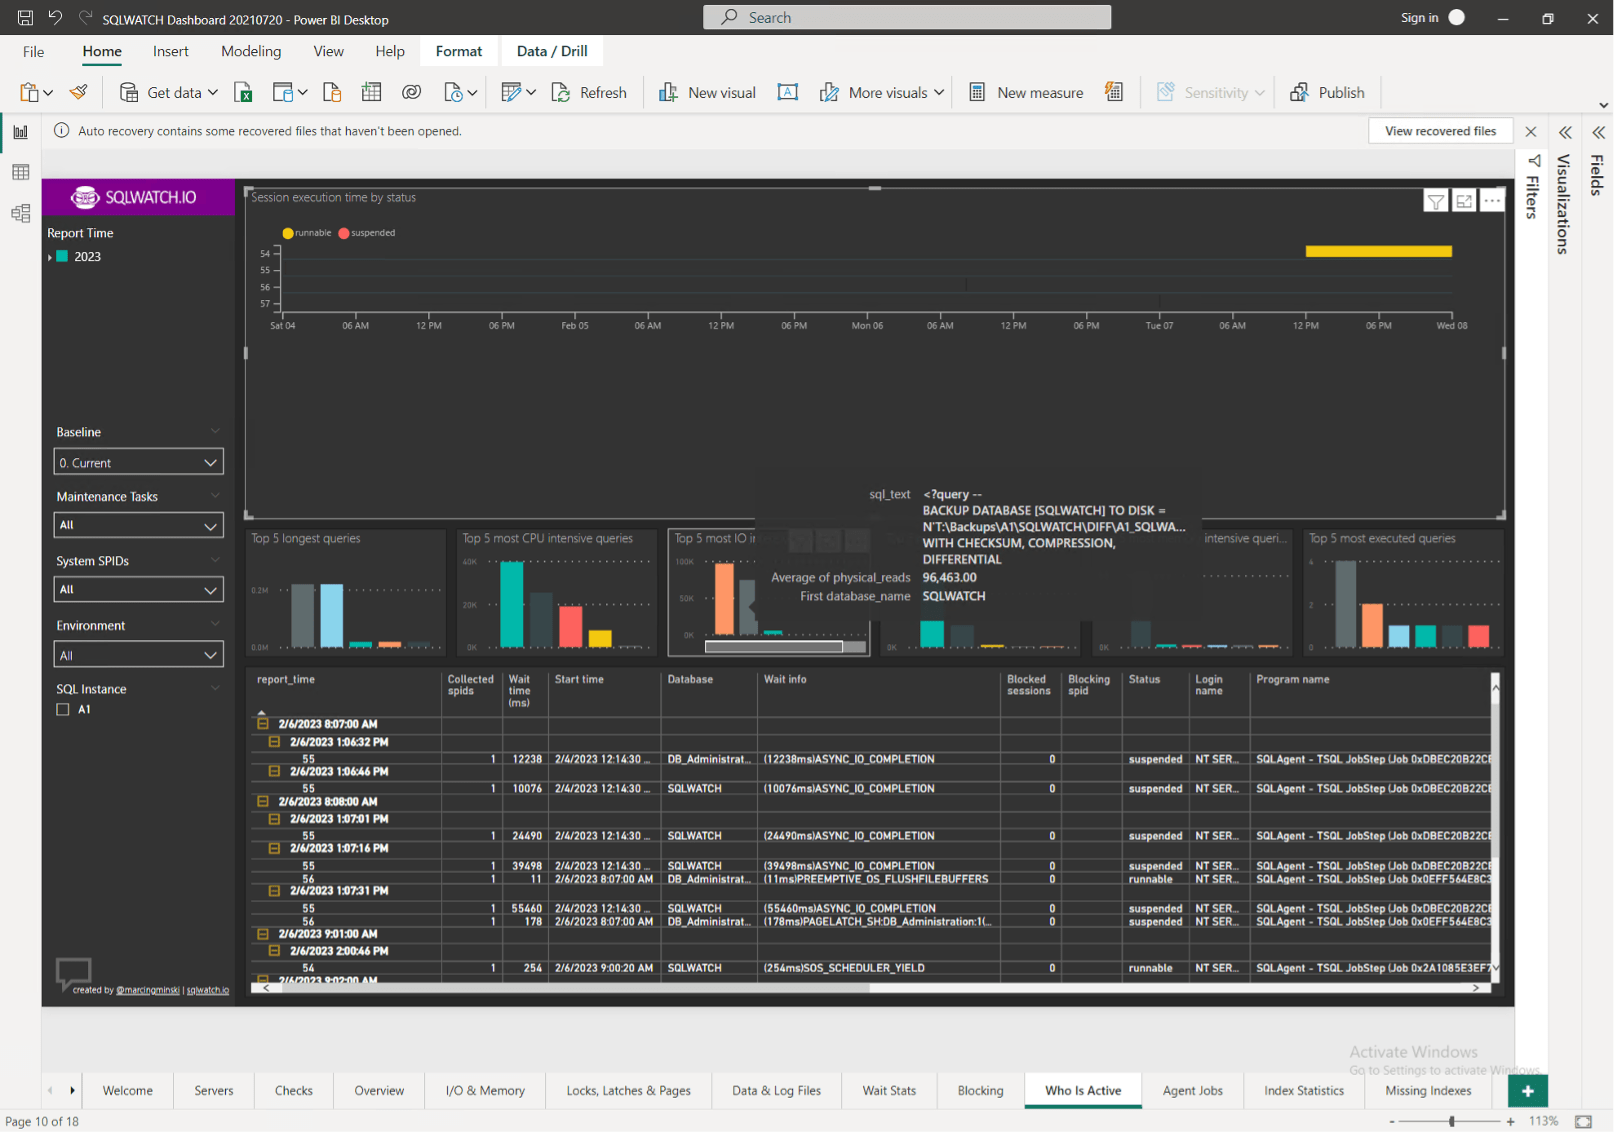
One interesting integration was the “Who Is Active” page which displays and analyses some of the data that would typically be stored in the WhoIsActive table via the data collection job; this is another awesome community tool! From a central management perspective, I think this is very useful to identify what may have been running in a specific time range, especially if you see a spike in other performance metrics such as CPU and memory usage or waits and blocking.
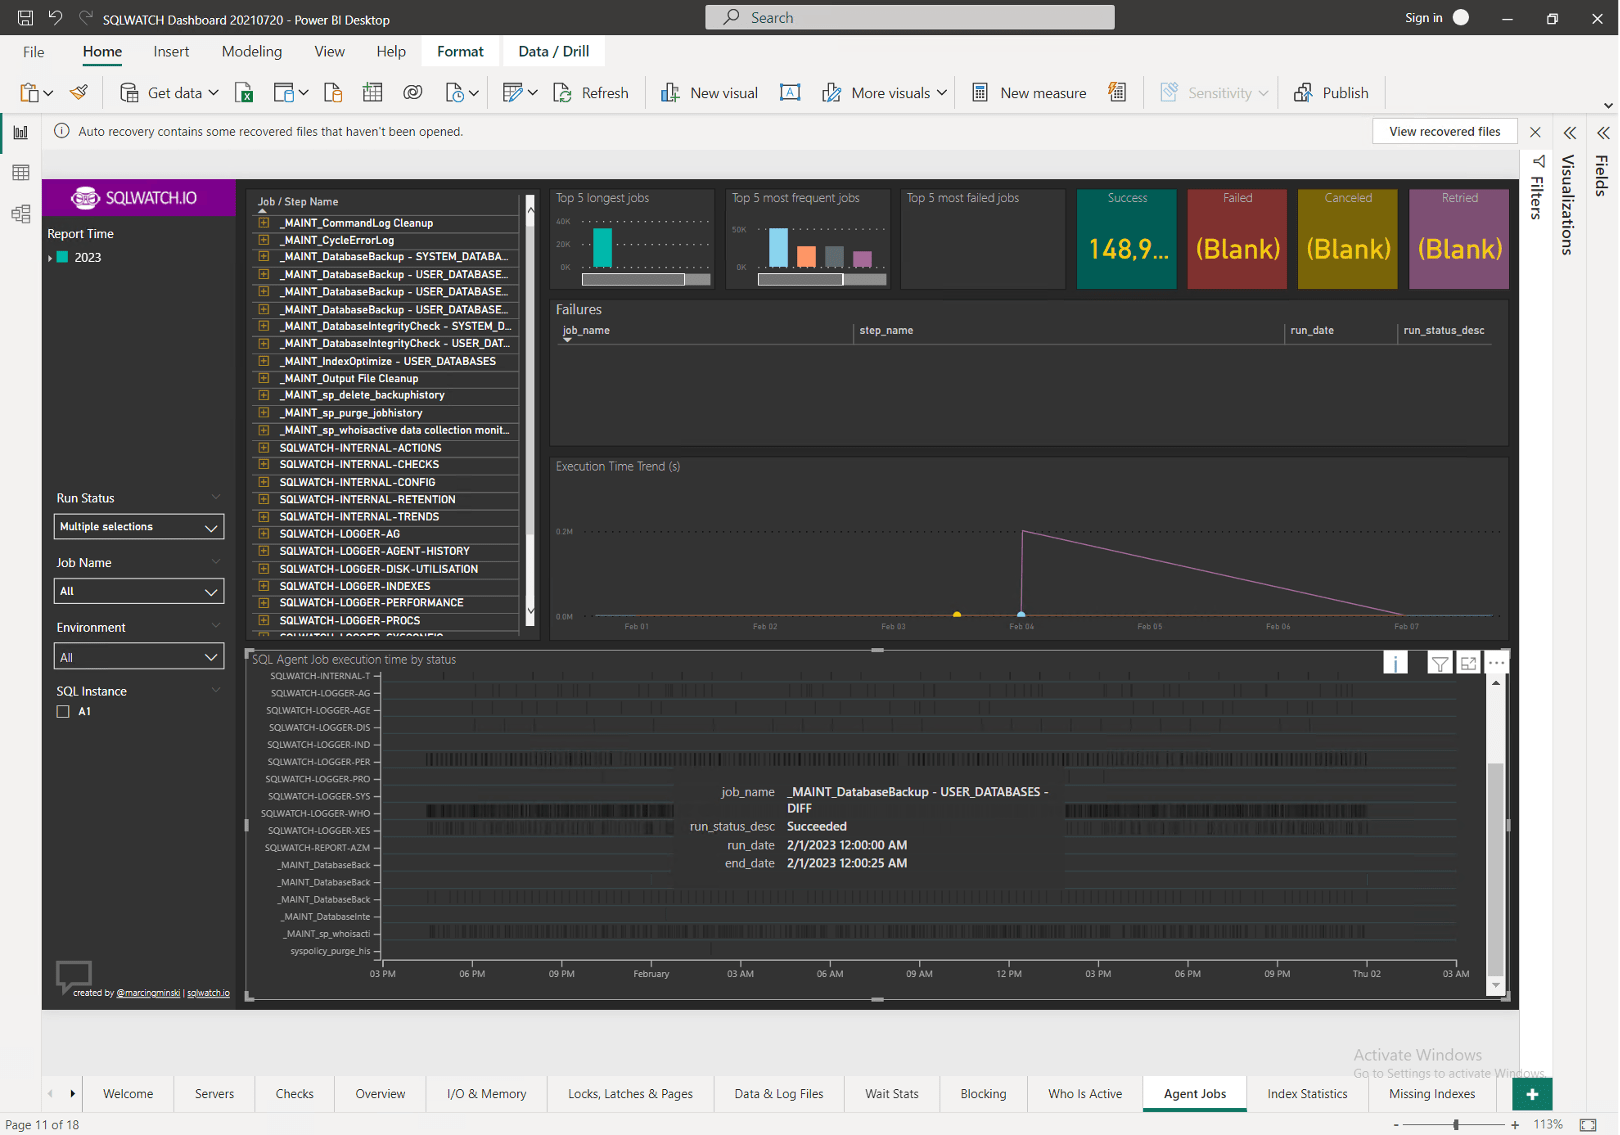
The “Agent Jobs” tab is another useful tool, and I enjoyed the visualization. Considering the different colors and a smaller timeframe, like 48 hours. This would be a useful tool to centralize Agent Job history and execution statistics. Those with more PowerBI experience would likely have more luck changing the background color, making it easier to see some of these graphs.
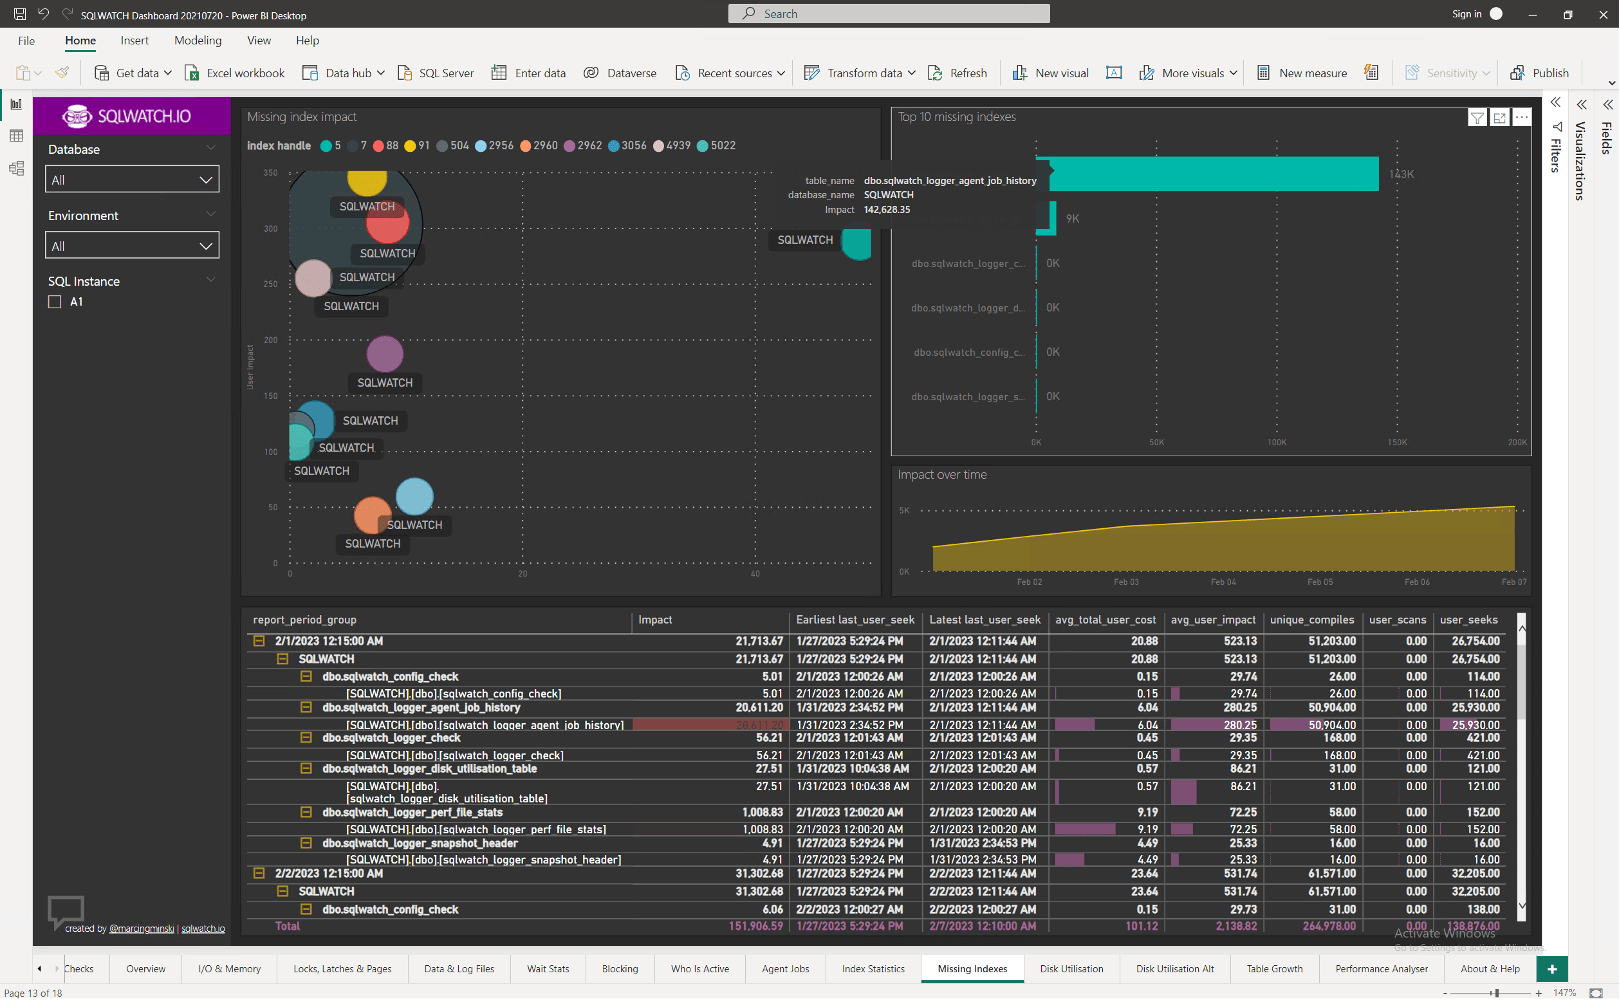
The “Missing Indexes” tab could be useful in kicking off performance-tuning sessions. I found it interesting that there were many recommended SQLWATCH indexes, but I will discuss my thoughts on that later on:
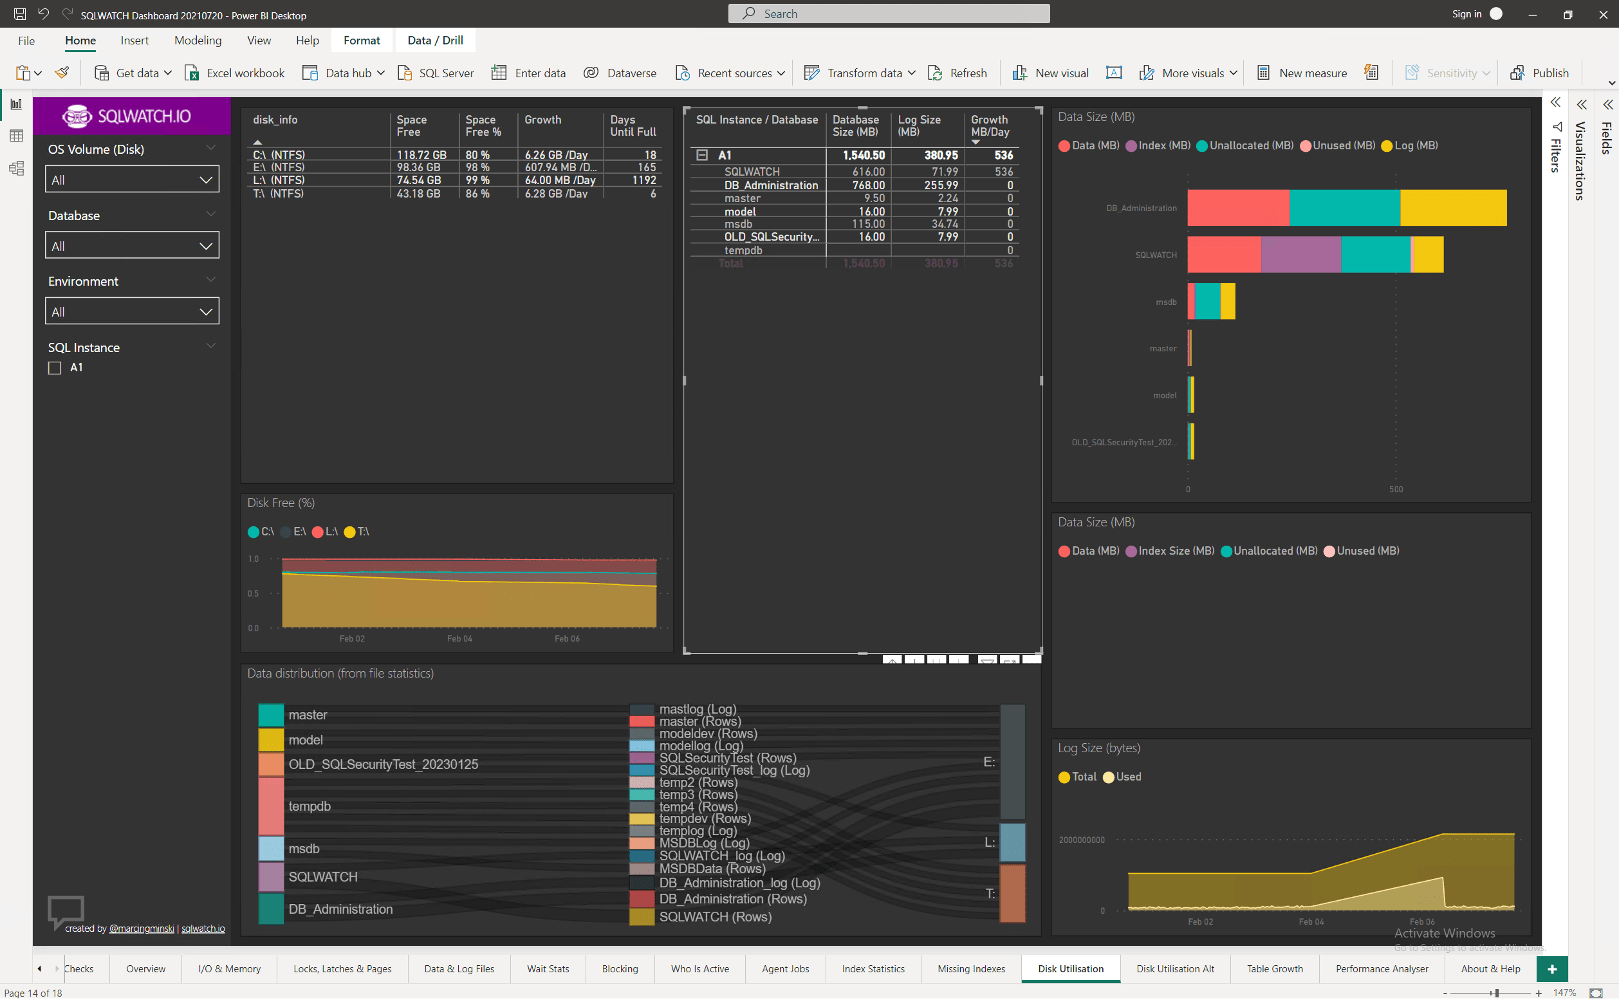
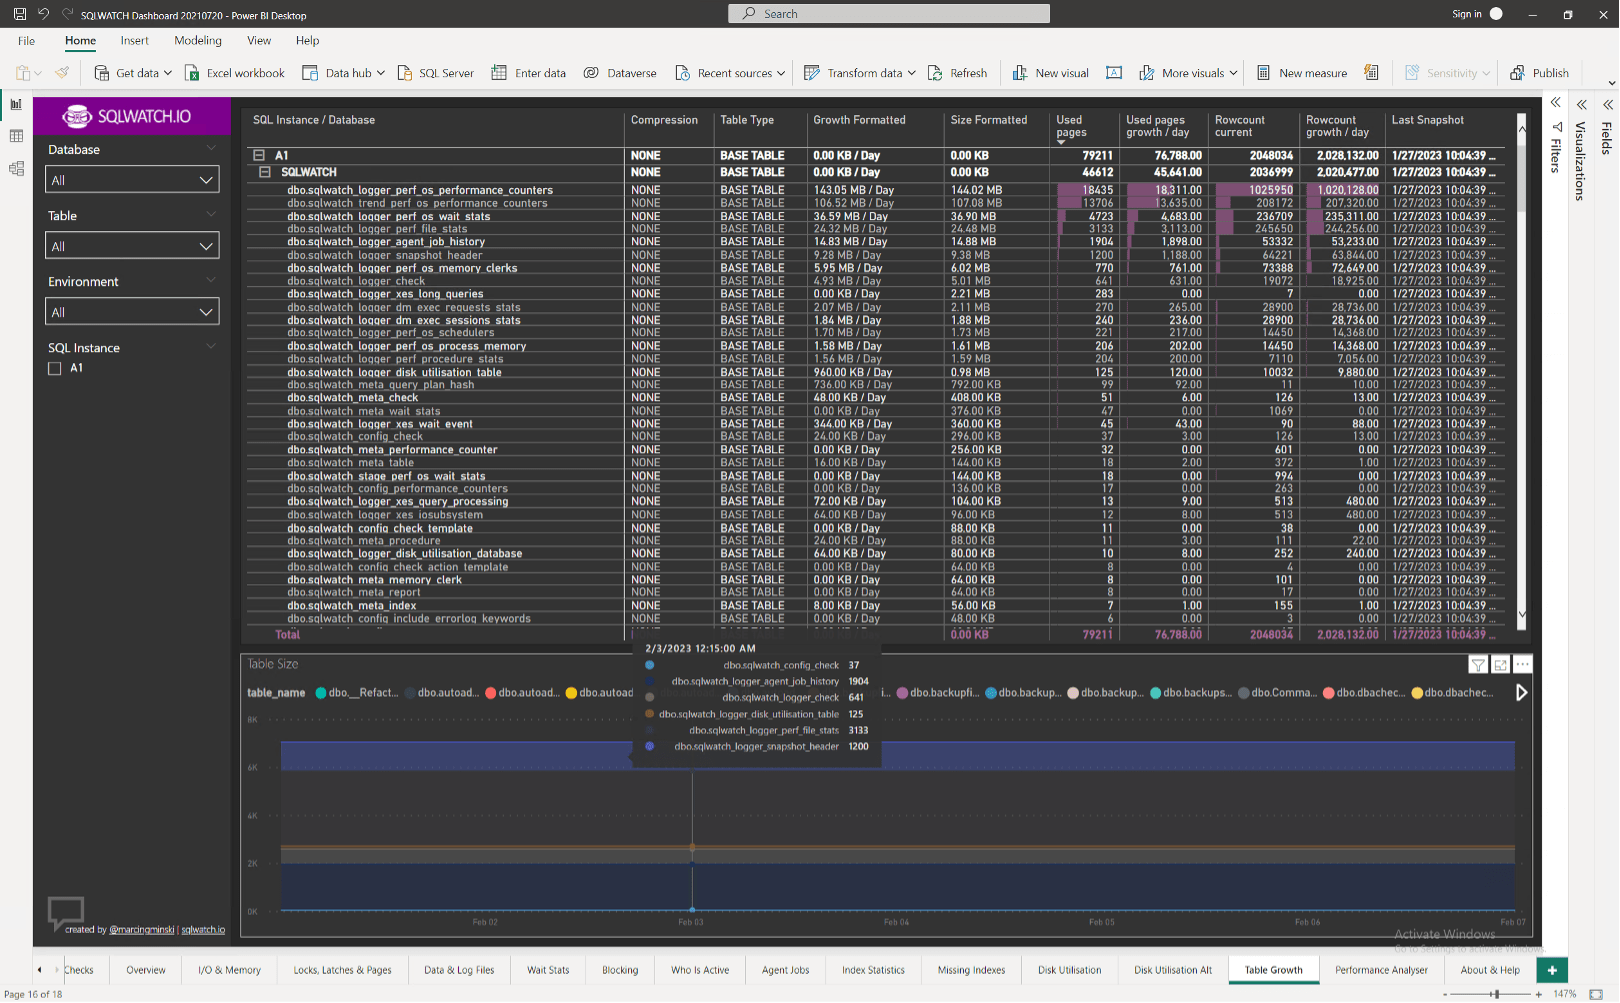
The “Disk Utilization” page is another very useful tool, especially for central management and predicting disk exhaustion. And further analysis can be done with the “Table Growth” page as well:
All of the pages are useful; these choices were just some of the highlights of what I encounter and look for frequently across our monitoring tools!
Further exploration
All in all, this is a very cool resource, and if you are looking for a free tool to gain further insight into your SQL server performance and work towards a centralized tool for maintenance and monitoring, I would recommend trying it out! I have not tested this in a production environment or on a production system. Just a small VM doing nothing. That being said, the logging database grew at about 536MB per day for just the one server being watched, and there may be some optimizations that could be used to improve performance. I am not sure about the PowerBI Desktop application’s performance with a lot more data to sort through as I had some occasional crashes as I would make changes or try to move quickly with the setup I described. I may try a local instance of Grafana next time and test both tools for visualizations (you aren’t locked into one or the other) as well as having multiple instances being monitored at once.
SQLWatch is a free community tool that can help you gain further insights into your SQL Servers. It is simple to set up and has most of what you want to see out of the box. With more elbow grease, you can set up multiple instance monitoring, optimize the database, adjust the visualizations, and set up alerting. If you need something free to help you see a bit deeper into SQL, try this out! Read more from others who have far more experience than me with it here: https://sqlwatch.io/blog/

