All of our SQL Server instances need benchmarks!
So the title is somewhat of a trick question… I hear and sense a lack of priority around taking periodic benchmarks in a system with a lot of folks. How often do you take benchmarks? Do you know what “normal” means for your system? Do you know when you may have a new problem before the users complain?
I have started working with a new (to me) tool in the past couple months that has made life a lot easier with benchmarking and it answers some excuses you might be thinking of why you don’t take benchmarks:
- My company won’t invest in a tool that costs money
- It takes too much time
- I don’t really know what to look for
- I don’t know what all the counters mean or what the values should be
- I don’t have the time to make graphs, compare data and make sense of it all.
In walks a PAL –> Performance Analysis of Logs (Literally, PAL). This is a free tool you can download from codeplex.
To run this tool you just need to simply grab the required counters (and most of the time it is at the object level so you can easily create a perfmon log file), run the log file and then run the log through the PAL tool which uses Log Parser (another codeplex download linked from the page above). You tell the PAL tool what threshold file you want to utilize (you can select from several predefined files including one for SQL Server 2000 and one for SQL Server 2005 which works for 2008). These threshold files describe the counters and help determine if there is a potential problem and apply colors (green/yellow/red) to indicate a potential issue. Each section also has great graphs to give a quick view of a particular counter.
This tool has a huge benefit to benchmarking. You just run your counter log (perfmon counter logs are normally pretty low impact to your system with their WMI calls) and parse it through PAL. Poof you have an HTML page with pretty graphs. Do this on a periodic basis and you have the start of a benchmarking tool. Troubleshooting some performance problems? Run this during a day of load and you can help zero in on some potential issues or directions to head down.
How difficult is it to use? Not very, let’ take a look…
First Setup a perfmon log: (Start/Run/Perfmon <enter>) Expand “Performance Logs and Alerts” right click and select “New Log Settings” Give it a name, maybe SQL Benchmark Trace?
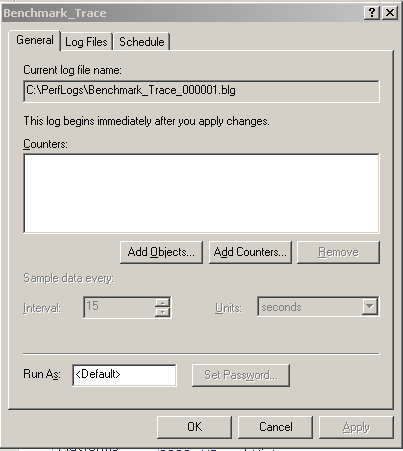
Next add Counters & Objects (to find out which ones you will want, install the PAL tool and look at the template file for SQL Server, you will see what counters to capture and what objects they come from). I will capture the following but you can look at tweaking down a bit and not all are required depending on what you are looking for. I get these from the SQL Server 2005 threshold file editing in the PAL tool and a simplification of creating the log:
Here are the objects to capture, tweak down as you see fit to make the file smaller and help lessen any potential monitoring overhead.
Physical Disk
Logical Disk
Process (I will sometimes tweak this down to just the SQL Server process)
Memory
Network Interface (sometimes I will tweak down to just the counters needed and just the NICs involved)
Paging File
Processor
System
SQL Server: Access Methods
SQL Server: SQL Statistics
SQL Server: Buffer Manager
SQL Server: General Statistics
SQL Server: Latches (Often I just look at the two required counters rather than the object)
SQL Server: Locks
SQL Server: Memory Manager
Next Setup a schedule/file location and thresholds for max file/rollover options/etc. Typically I put the files to the C:\ drive or if I have a “utility” drive that is not used for anything critical to operations (no paging file, no SQL Server database files, etc). I also will set a max file size to be sure that no issues arise from a drive running out of space. These options are mostly self explanatory on the Log Files and Schedule tabs. I always log to a binary file (and for PAL you need to do that, I believe) the SQL option is out because I don’t want to incur cost on the SQL instance.
Next wait for the log file to run for your specified threshold, bring the file to the machine (I normally just use my laptop or PC) that you are running PAL on. Launch the PAL tool:
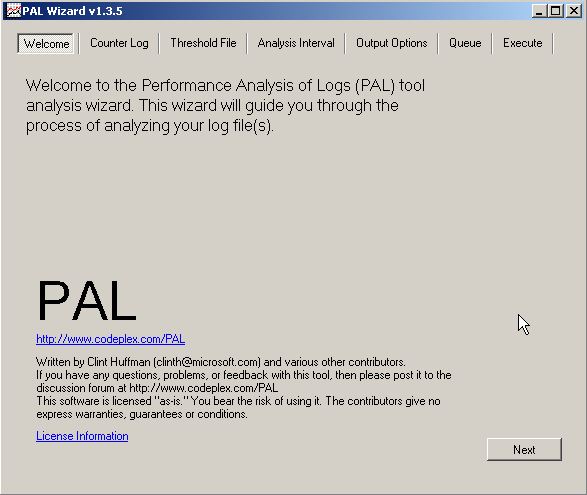
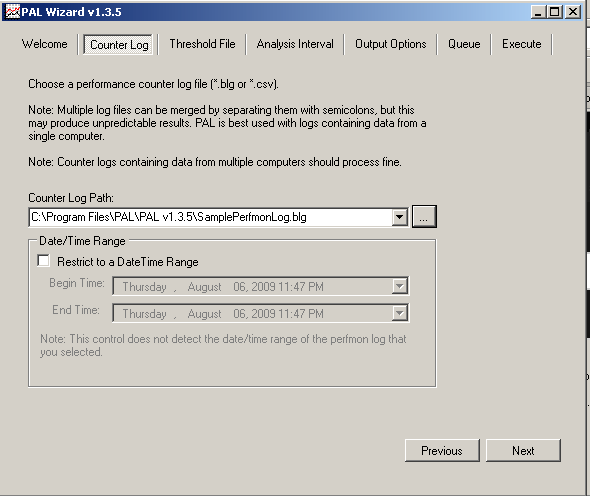
Click Next and browse to your log file. Restrict to a time period if you want to look at a subset of the data in the file.
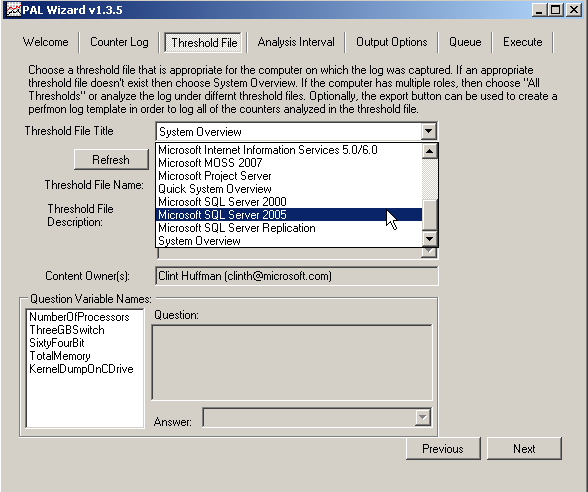
Click Next and select your threshold file (I selected SQL Server 2005 in the screenshot below but the file output shown is an anonymous file taken from SQL Server 2000)
On this page you will also be asked a few questions to answer at the bottom. Number of processors (cores), ThreeGBSwitch (enabled or not), 64 bit or 32 bit?, Total Memory on server, KernelDumpOnCdrive flag (there is an alert to indicate a potential flaw of not enough free space for a dump):
In the the Analysis Interval tab, I typically accept the default (Automatic). Basically the PAL tool will break your file up into slices of time (it takes 30 slices for the period shown). You can change this if you want to have a bit more control over the way the averages and maximums (spikes) and minimums are reported. I typically leave this alone and won’t waste your bandwidth with a screenshot.
The output options tab just asks where you want the file to be saved and if you want the output to an HTML output (default), an XML output or both. I typically work with the HTML but I bet someone could create an import process for the XML to setup some code to analyze baseline data overtime and flag an alert if something gets worse. Again, I’ll spare you a screenshot.
Queue – This tab gives you the ability to store the output from the options selected. It shows you the switches and options for the .VBS command to be executed.
The Execute tab allows you to either immediately execute the options you just selected (what I have chosen every time I use this tool so far) or to simply add the script you just created to a queue so you can add another analysis to the same queue and process multiple at once. Also an option to execute as a low priority. The execution can take quite some time depending on the size of your log file and amount of time in the file.
Once you click execute a command window opens showing you the progress. Ultimately an HTML output file is displayed. This shows graphs of each of the counters looked at for the time period:
Below is a graph from the sample log file provided with the PAL installation:
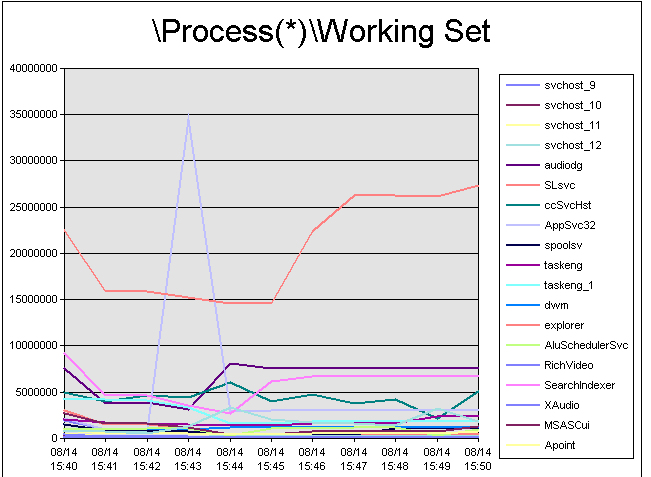
Similar looking graphs are shown for each counter specified. You can look at just the graphs as you scroll through to find correlations with each other (for instance did your batch requests/sec jump up just as your disk latency shot up? Did some other process cause memory pressure while your free pages dumped, etc.)
Alerts are also shown when instances of counters go outside of the threshold formula (some thresholds are simple: disk latency for instance. If the avg. latency is over the Microsoft recommended value a yellow will be shown with an alert fired, if it goes above the next number 25ms, red is shown.. If there are high spikes they will also trigger an alert). You can look at these alerts and see if there is a trend (did you have a spike in disk latency during a backup operation or bulk load but the rest of the time yo uare fine? or did you see a mostly acceptable average with a consistent spike in read latency, maybe you need to dig deeper… Did you see free pages going down consistently and full scans up consistently in correlation with these disk latencies? Now you can start looking at potential code/database issues… Maybe you will want to run some traces and analyze them with a tool like ClearTrace, SQL Nexus, SQL Diag, etc… Maybe you want to look at some of the query execution DMVs).
Here are some spikes shown from the sample log file:

The other benefits of this tool? It has descriptive information discussing the counter you are looking at that can help you better understand the counter and acceptable limits:

The information is all arranged on a simple HTML report with hyperlinks to sections as well as a summary list of counters by time period so you can either look at likely suspects you are looking into or dig into a time period that you care about.
Adding simple tools like this to your repertoire can make your life easier, help you present information to management easier and help you stay on track of your environment. Don’t end up with the users being the main source of information on how your system is performing.
And for just a little bit more money than free you can get some great tools from a number of vendors that provide even more information and most provide pretty graphs and reports that help you keep your environment in check. So you can spend a little time and use a tool like PAL with the DMVs and a little ingenuity or a little time and a little money and buy some tools.
I don’t care how you do it, just do it 🙂 It’s 2009 and we should be more responsive to our databases by now. Except for the edge cases we really have no excuse now for being surprised by the majority of performance issues that surprise us today.
Like content like this? Subscribe to the StraightPath SQL Server blog feed in your favorite feed reader.


4 thoughts on “Benchmarking… Who Needs It?”