Availability groups, Failover Clusters, Log Shipping, and more. These are tools we use to ensure that the data is highly available and disaster recoverable. This post will be the general walkthrough for how to determine what may be going wrong with your HA/DR solution, as well as some general tips and tricks from what we have seen through working with our clients.
With all SQL server issues, there a few locations that can help you determine if something is going wrong at all. The first of which is the SQL Server Error Log. Once you start up SQL Server Management Studio and connect to the server, you will see a few navigation options. Under ‘Management’ at the time of writing, you can find the ‘SQL Server Logs.’ This will be cycled upon every restart, or if you have Ola Maintenance installed, it would be cycled every week. Make sure you pay attention to the date range for the box that is checked, especially when looking for an issue on a specific day and time (don’t mind the timestamps of my error log, I am a bit of a night Owl!):
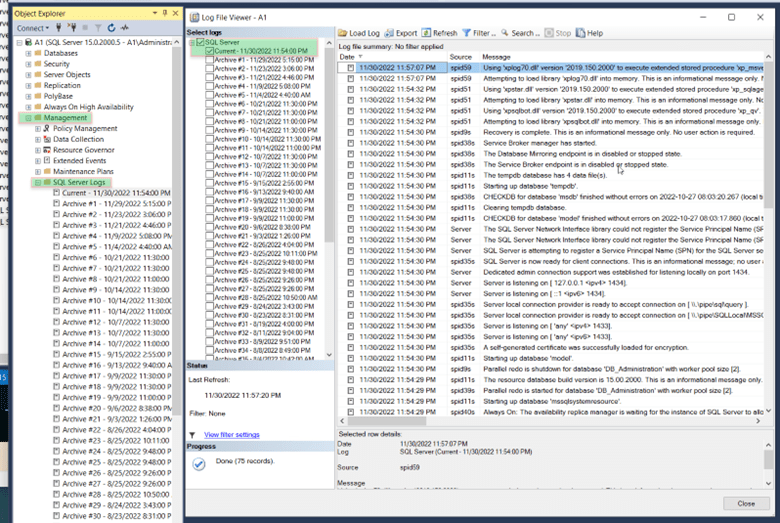
Once you have the SQL Server Logs pulled up, also known as the SQL Server Error Log – you can scroll to the time you think there may have been an issue and see if there were any errors to correlate to a failover or unexpected behavior in the server.
Once you have a general keyword for what you are looking for, such as ‘Availability’ or ‘Shutting down’ – you can filter or search to see how often something showed up in the log or to see what was happening around the same time.
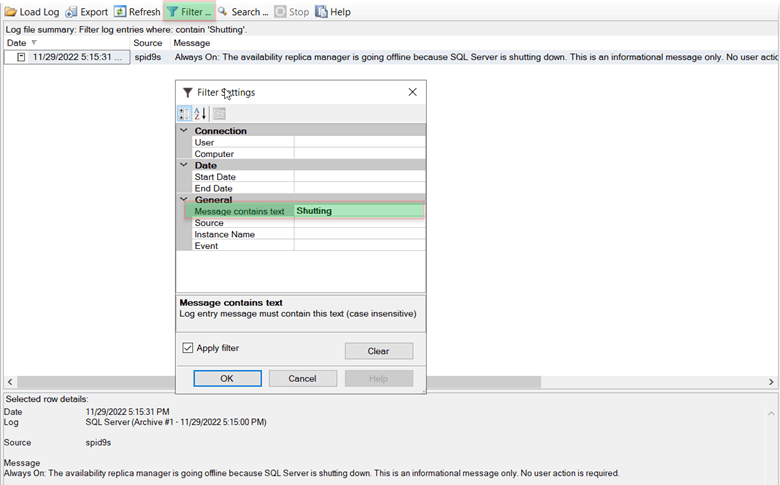
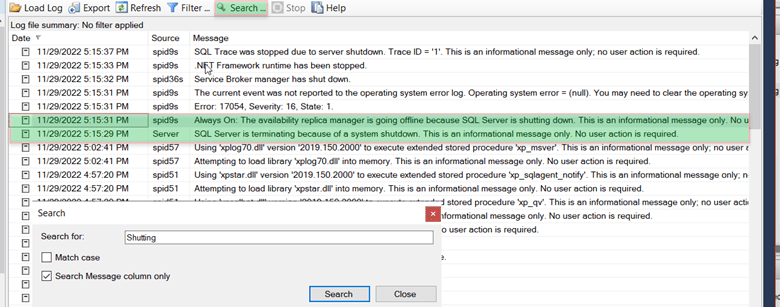
The ability to navigate and read the SQL Server error log is a big step forward in identifying possible causes for an unexplained outage or helping figure out why something isn’t working the way you expect. You may be like me and see plenty of login failures in the error log after you’ve set up your availability group because you haven’t provisioned access for the computer or agent accounts on the other replicas. However, not everything is in the SQL error log. There are other considerations, specifically during setup or when firewall or networking changes are being made; you may need to look at the Event Viewer. For this post, I will be focusing on the Windows Version:

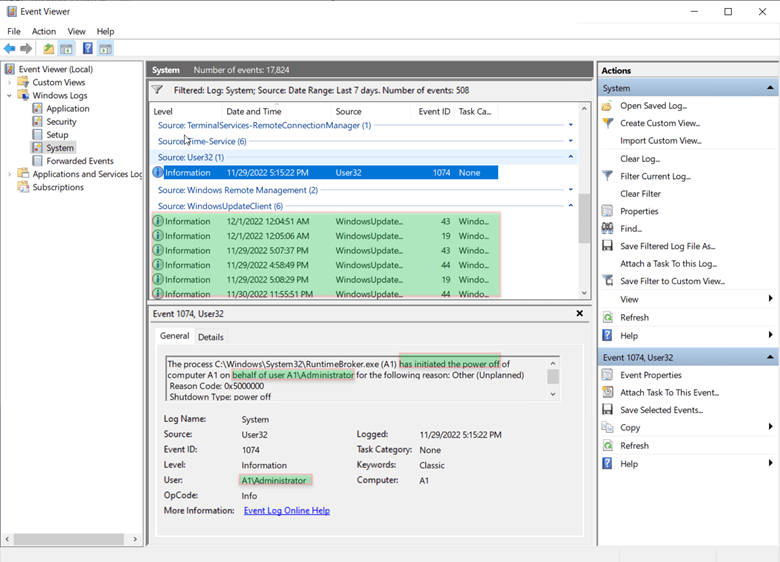
Like the SQL Server Error log, Event Viewer records System and Application (and more) events that you can use to help with Root Cause Analysis (RCA) and Troubleshooting. Why was there an unexpected failover? Well, because the server was shutting down. Why Was the server shutting down? Event viewer may tell you! A few of the tips I recommend, beyond scrolling to the correct time in the log, is to Group events by the ‘Source’ column, sorting by time descending, and using Filter current log for the specific dates and times I care about. This first set of examples is in the ‘System’ event log.
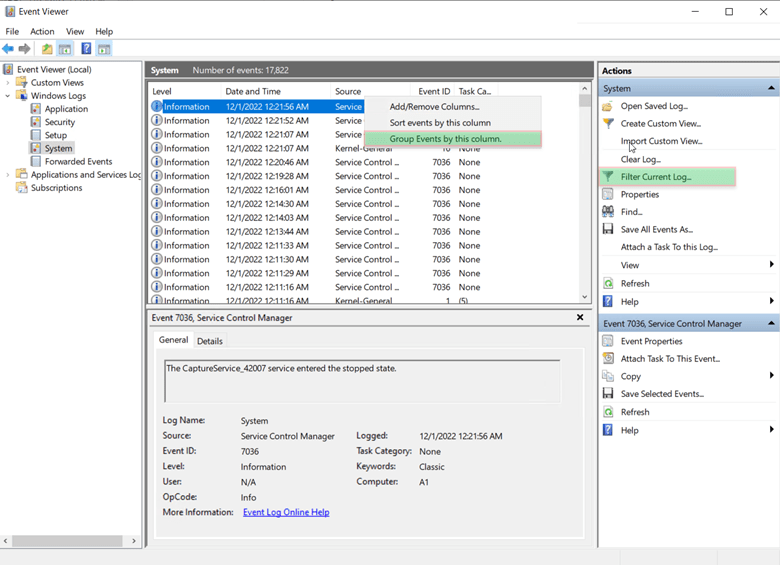
Some of the most frequent culprits on our list for unexplained failovers or restarts are from the ‘User32’ or ‘WindowsUpdateClient’ Sources. These typically mean that an internal user restarted or shut the computer down, or a Windows update did. Midday Windows updates have not been an uncommon cause of unexpected performance issues on a production server. I will take this opportunity to remind you to make sure automatic updates of all kinds and from all apps should be disabled on production SQL Servers!
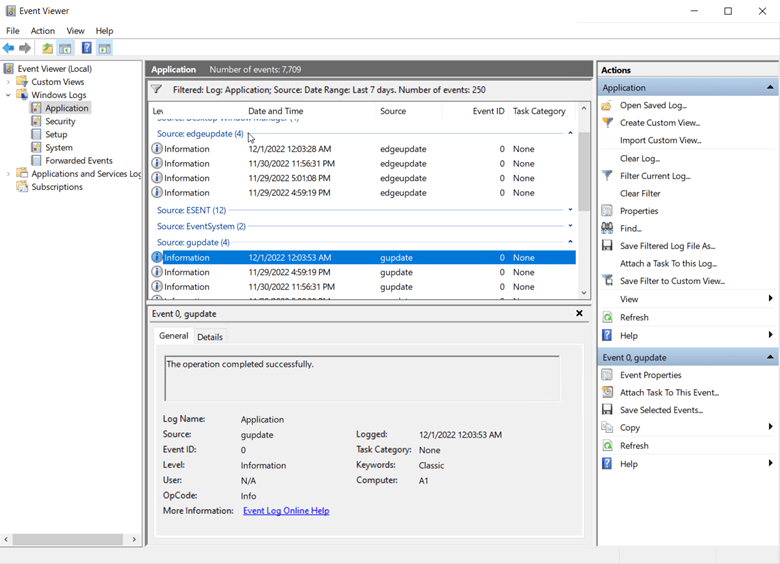
Hopping over to the ‘Application’ log, you can use the same kind of grouping and filtering to find other relevant application behaviors and errors. Since my test server is pretty boring, I will show you that my server has automatic updates running for Edge and Chrome!
Side bar, some apps sneakily add their auto-update jobs into Task Scheduler – take a quick peek to see if that has happened to your server like it did mine!
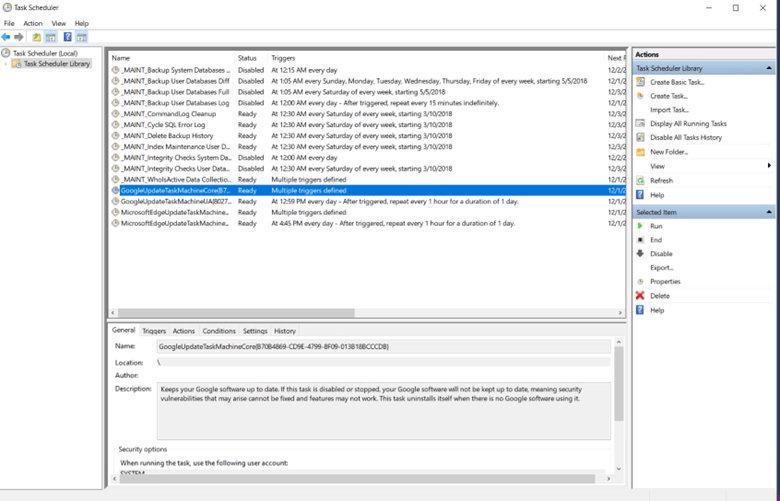
Don’t misunderstand, do keep your apps and server up to date – just be aware of when it is happening so that you aren’t scratching your head because there are automatic updates running for three or four apps in the middle of the day.
Once you are done in the Event viewer, there are a couple more places to consider. For Always on availability groups, you get the AlwaysOn_Health extended event session set up as well. This will hold failover event data for you, which can help you identify, among other things, when failovers occurred.
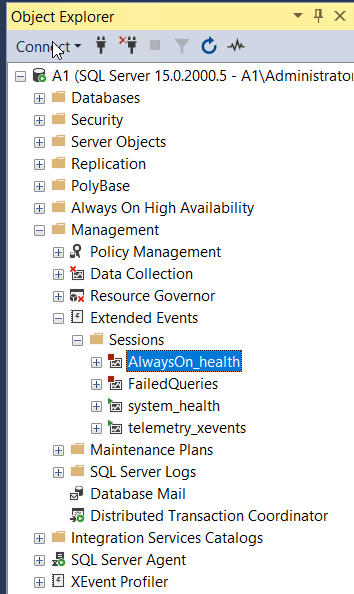
Using this time data, you can cross-reference the SQL server error log as well as the event viewer to see what may have happened at that specific time on the system. And hopefully, come to a root cause.
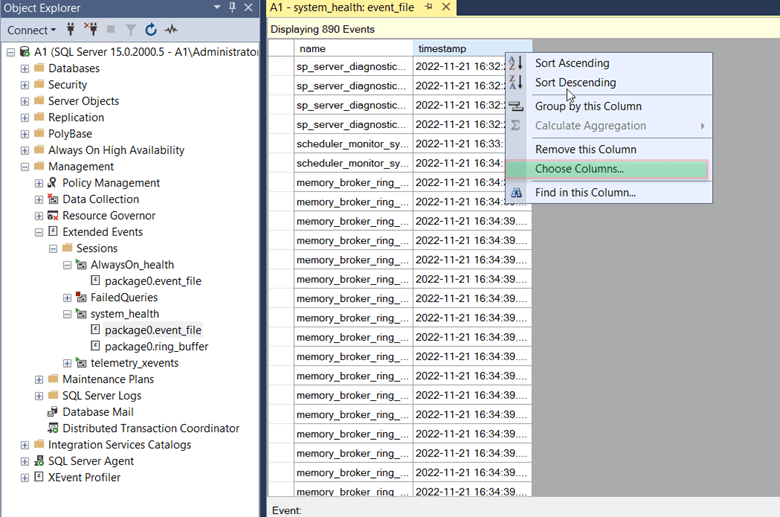
A brief dive into Extended events, these are a more sophisticated form of logging than the SQL Error log, and for those in the know, it was designed to replace SQL Profiler in the amount of resources required for logging. However, there is still a consideration to be made, and many performance-minded clients will have these turned off. These extended event sessions can be a very useful fountain of information if used correctly. Similarly to the Event viewer, you can manipulate what is shown and how to make it easier to see what happened, or is happening, on your server. Since I do not have an availability group set up on my Test server, I am looking through the ‘system_health’ event file:
Opening it up, I see ‘name’ and ‘timestamp.’ By right-clicking on one of the column headers, I can ‘choose columns’ to make it easier to see the information I am looking for.
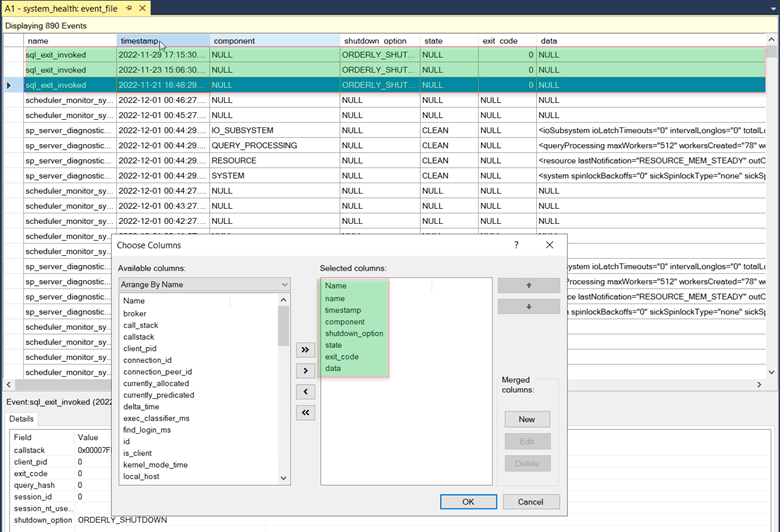
Adding a few columns and experimenting with the options will help you see a bit more about what is going on as you look through the events. You can also sort by each individual column. In my example I can see when all the recent orderly shutdowns occurred. This helps me ask further questions and again, cross reference the other logs.
There are further things to look into for troubleshooting various HA/DR solutions, such as the Windows Failover Cluster Manager Event Logs, inspecting various configuration options such as allowed latency between replicas, and more. However, these are a bit more in-depth and would go up into the more experienced DBA level. I hope you can use this as a starting point to find your future issues quickly. Be ready for your search bar expertise to come in handy as you delve into the world of logging!
PS. We enable trace 3226 to suppress ‘Backup Successful’ messages and to have an easier log to sift through when it comes time!

