I’m on the return home from Relativity Fest. This post has been in a few draft forms for a long time now but in the session that Jared, Carlo and I gave, and a couple of the questions we ended up hearing put the fire back into finishing my thoughts here and clicking publish. In our talk, we tried to hit on the full suite of challenges and issues we see – especially with Very Large Relativity Workspaces from our various vantage points. Jared and Carlo from being in kIE or on Lit Support teams or from Carlo’s time on the (formerly known as) advice@ team. My vantage as the SQL Server consultant who has been in some pretty hefty hosting partners, firms, corporate and government environments and seeing some of the same things over and over. One of my main points was a quick and straightforward “SQL Server – or any of your infrastructure for that matter- is NOT set-it-and-forget-it!!”
In the time I had, I hammered checking not just performance minded factors, but being sure that your databases are being checked for corruption, making sure your SQL Servers are configured right, making sure backups are happening. The first set of things we look at when we do a SQL Server Health Check for a Relativity using firm – or anyone – here at Straight Path. And a question we had in each session was “How do I know that these things are good? How do I know that these things are getting done?” Asked more from the LitSupport Project Management or even case support team role.
I have three answers for that question. I’m going to quickly zoom in on the third answer with the full knowledge that the third answer, to Relativity’s amazing credit, may impact my company’s bottom-line. You see, I like doing SQL Server Health checks. I love doing infrastructure and performance assessments for Relativity shops. It’s a tremendous value-add, an inexpensive investment and it usually opens up a long-term relationship with some clients we love serving. But here’s the deal – the third answer will give you some of the basics. And it won’t cost you a dime (well not a dime more than your hosting, infrastructure and license costs you’re already paying.)
How Can I Be Sure Relativity’s SQL Databases are Happy?
Answer One: Do Your Own SQL Server Health Check
I blogged about this a couple of weeks ago. You can roll your own check, or download some of the well-written scripts out there from excellent SQL Server community resources. Whether it’s the Glenn Berry scripts. Brent’s Blitz Scripts, or whatever. You can jump into SQL Server and start investigating your own environment. You can also talk to your technical team and ask them to check these things out. Hopefully, you have a great relationship, and you either have a full-time SQL Server DBA on staff, or you have a relationship with a firm that can provide that expertise remotely when you need it. Ask them. Ask them to show you the reports.
Answer Two: Buy a SQL Server Health Check
I won’t drag this one out. That blog post I referenced in answer one talks about this. I’d love to come in and check things out, and we look deeper than Performance Dashboard can go, but if you are just trying to ask “How much data am I at risk for losing? What query is killing us? How long has it been since our last CheckDB?” I’d be less than honest if I didn’t tell you about my favorite answer for Relativity users.
Answer Three: Relativity Performance Dashboard
What can I say? This tool was a long time in the making. It started with an idea and some scripts and grew from there. I got to watch the pieces come together over the years and watch this get rolled out. It’s fun. I even got to maybe contribute about 0.876% to what’s inside of the checks on the SQL Server side with some advice, conversations, and calls. This tool, sadly, is still best known in the Relativity User community as a tool that only shops looking to earn or maintain Best In Service designations need to worry about. That’s unfortunate!
While it is true that Performance Dashboard is used to grade and score Best In Service clients, it’s also available to you as well! What is it? It’s a powerful tool that can be installed into and live inside of your Relativity environment. Relativity makes it and supports it and Support would be more than happy to get you setup with it, I’m sure.
I could spend more of your precious time describing it, but I believe a bunch of screenshots hammer the point home for me. In short, though, Performance Dashboard is a powerful interface for you – for anyone with access to it in your environment – to see how healthy your environment is. You can see database and system configurations, up-time scores, you can find out which users and which searches are causing most of your pain and you can see if you are at risk for data loss. It’s a tool to keep us infrastructure types honest when the RCAs are using it. It’s a tool to keep the case teams and folks setting workflow up honest when us Infrastructure types sneak a look at the queries making our SQL Server storage cry.
So I give you screenshots (and a plea, even if we lose a client engagement because of it! Install this. Look at it. Use it. Next year, I want to see way more hands go up when us speakers ask “who uses Performance Dashboard?”)
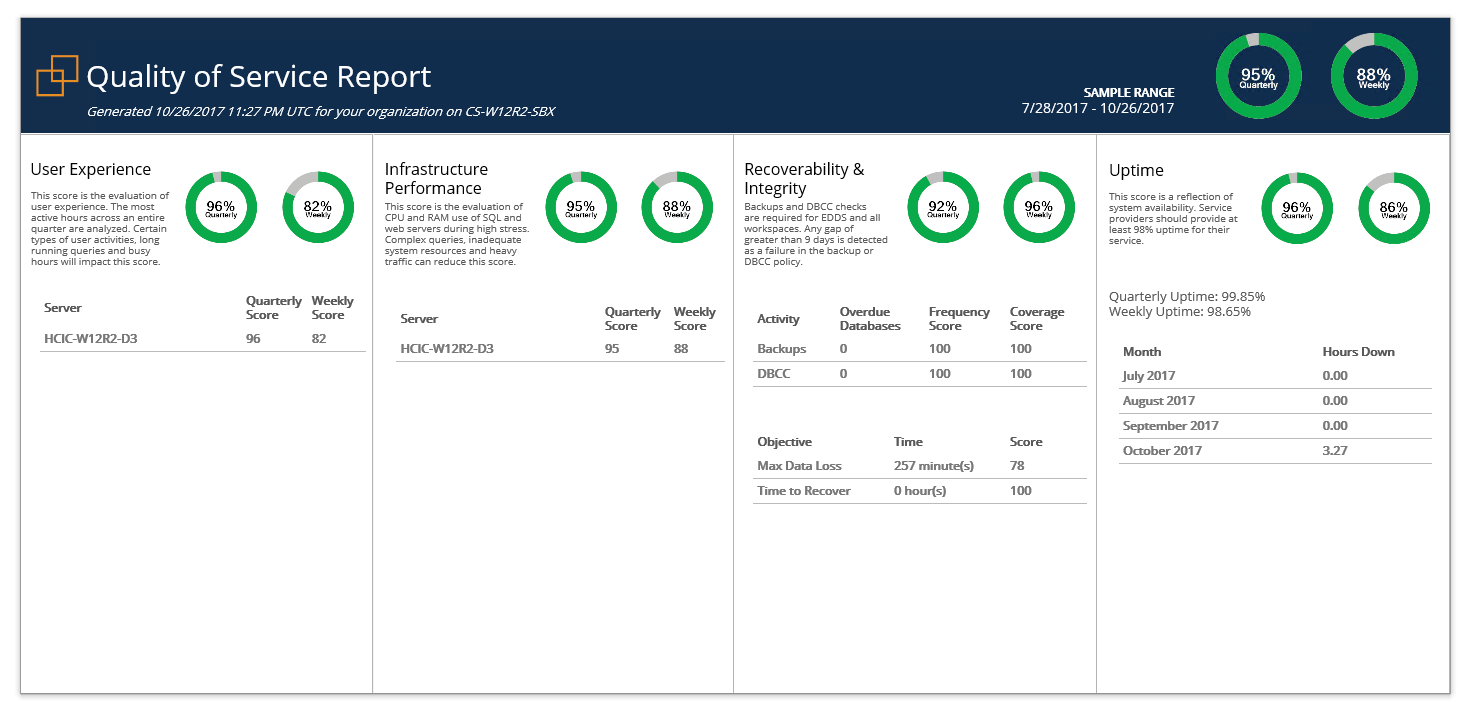
When you first log in and click on Performance Dashboard after it is installed and has collected, you get to the Quality of Service Report. I won’t get into the way weeks are measured to come up with the score – it matters for Best In Service – but to see how healthy you are, it becomes entirely self-explanatory as you go.
Let’s say we wanted to zoom in on our Recoverability and Integrity – how much data could I potentially lose if we had an issue right now? Are my DBAs or accidental DBAs running database integrity checks looking for corruption regularly? Click the score in Recoverability and Integrity and you come to this screen:
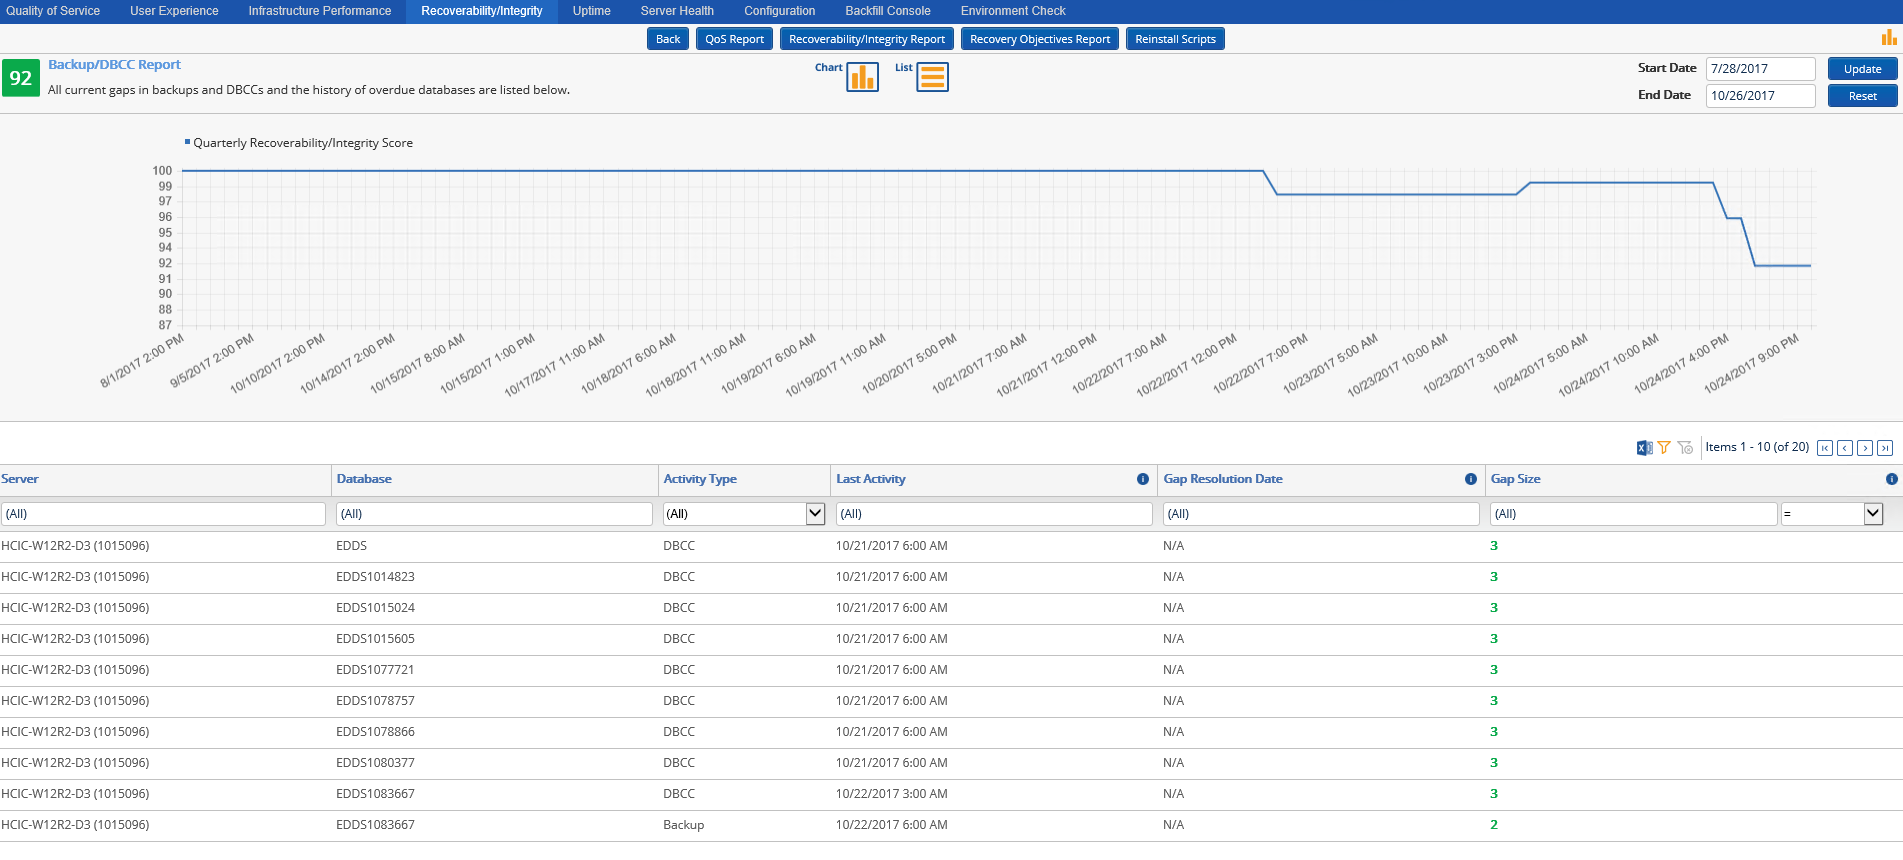
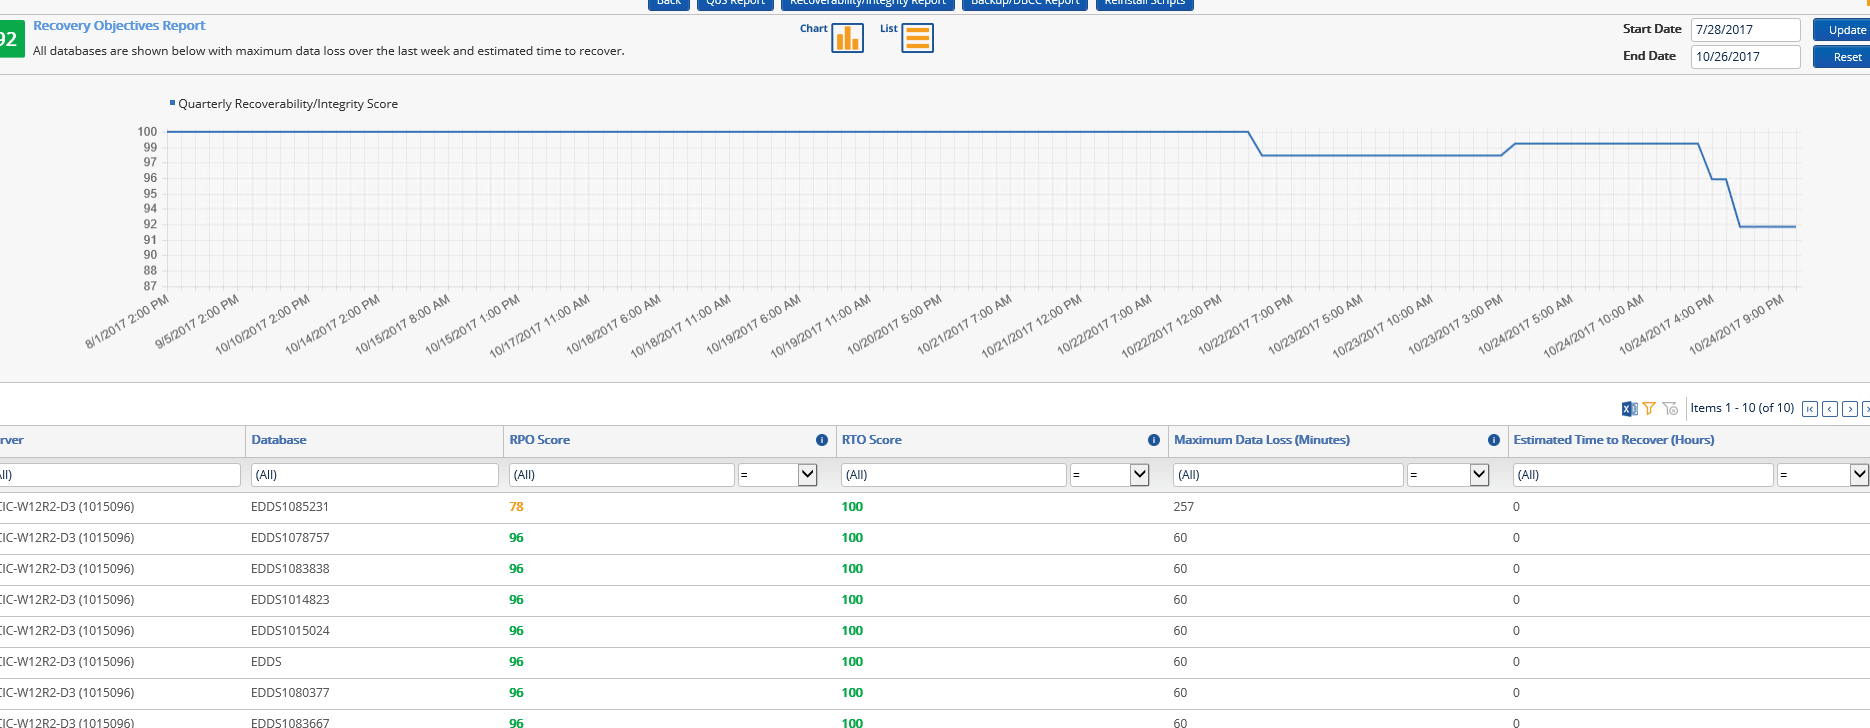
This report shows when the last activity of CheckDBs (DBCC) or backups occurred. The graph at the top helps keep folks honest, too. If things just got better and then you get access to PDB, you will still see some of the histories, in fact, the score doesn’t rebound instantly anyway. What if you want to see more details on backup recovery options and how much data you could lose?
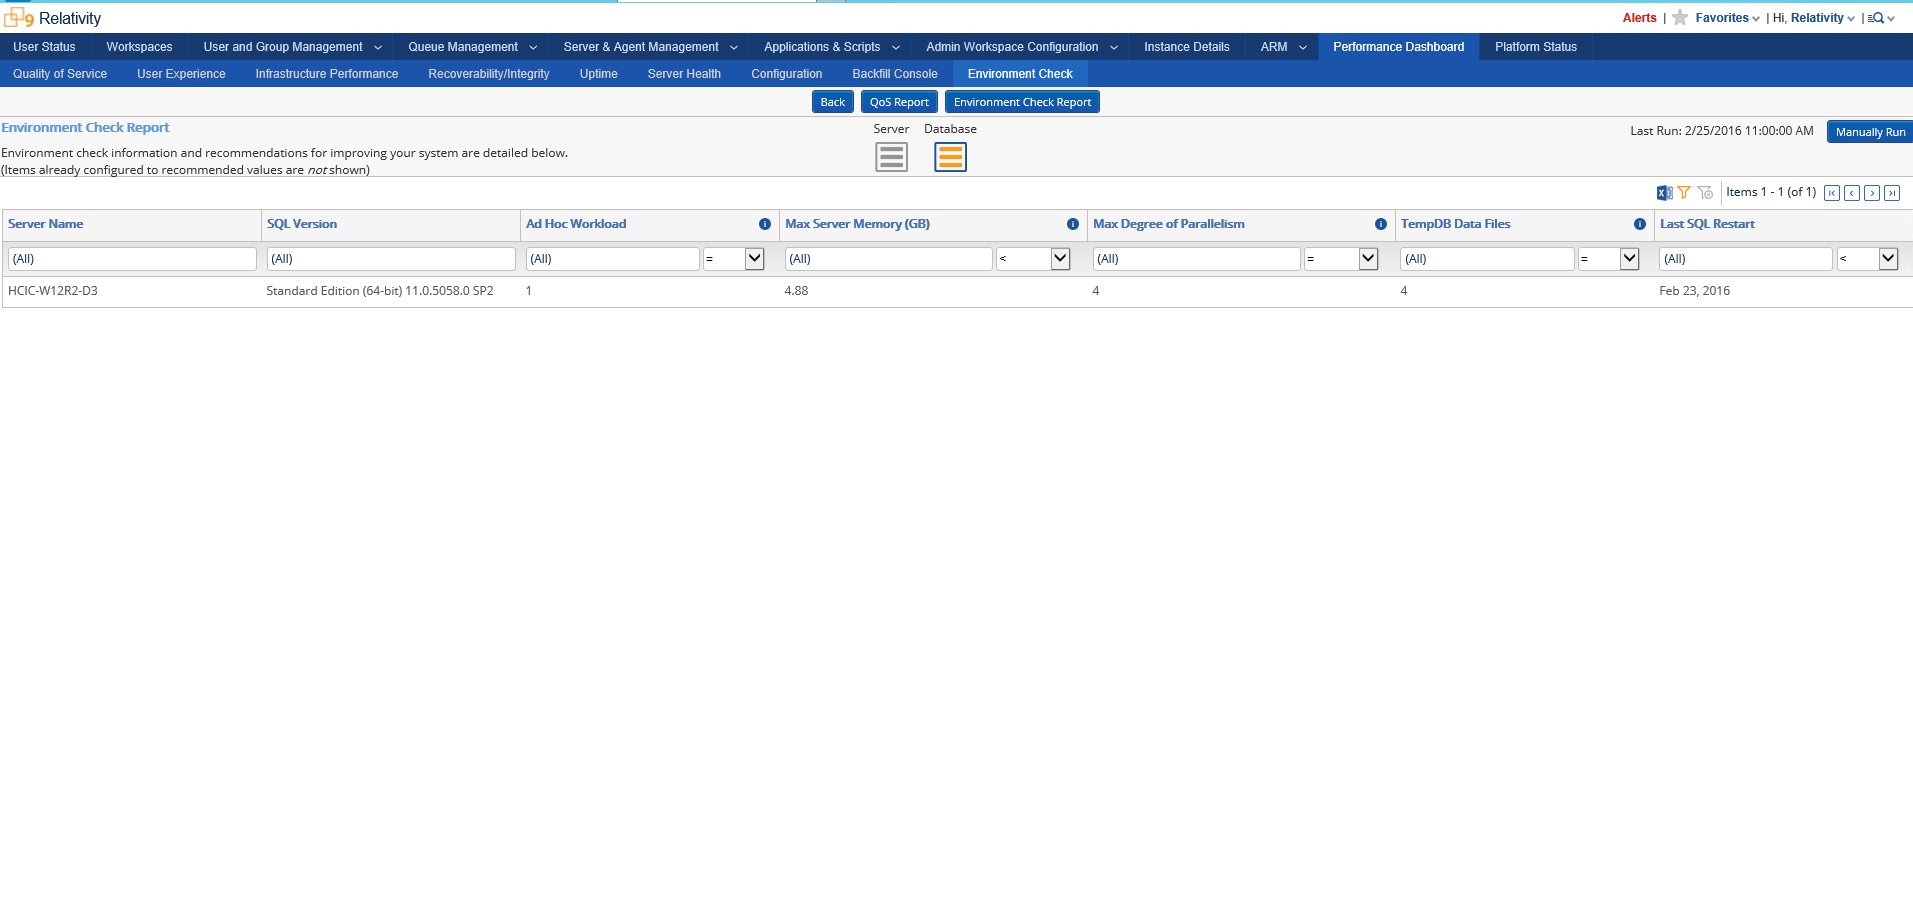
What if you wanted to see how your servers were configured? Are you following best practice SQL Server Configurations? Don’t reach for the health check tools or my number just yet:

What if you wanted to see how your servers were doing CPU and Memory wise? Or on a few other metrics like IO latency or VLF fragmentation in SQL Server? There’s a report for that, too:

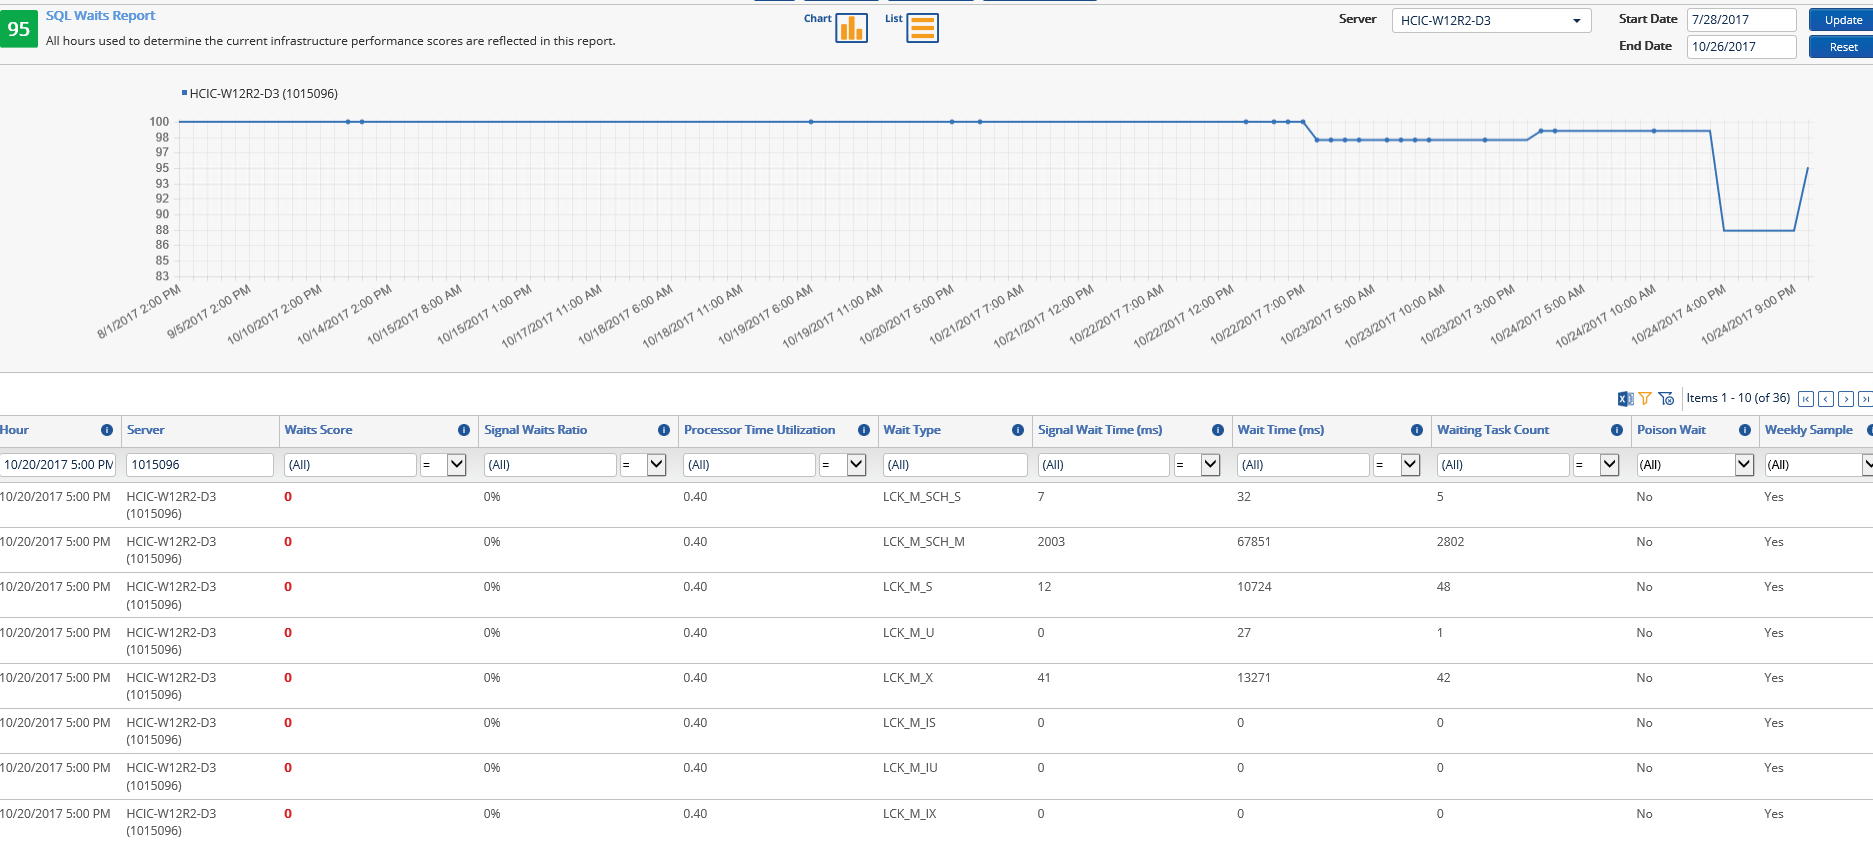
Maybe you want to know why your queries are waiting? Maybe blocks or poison waits like threadpool waits – well there’s a report for that, too.
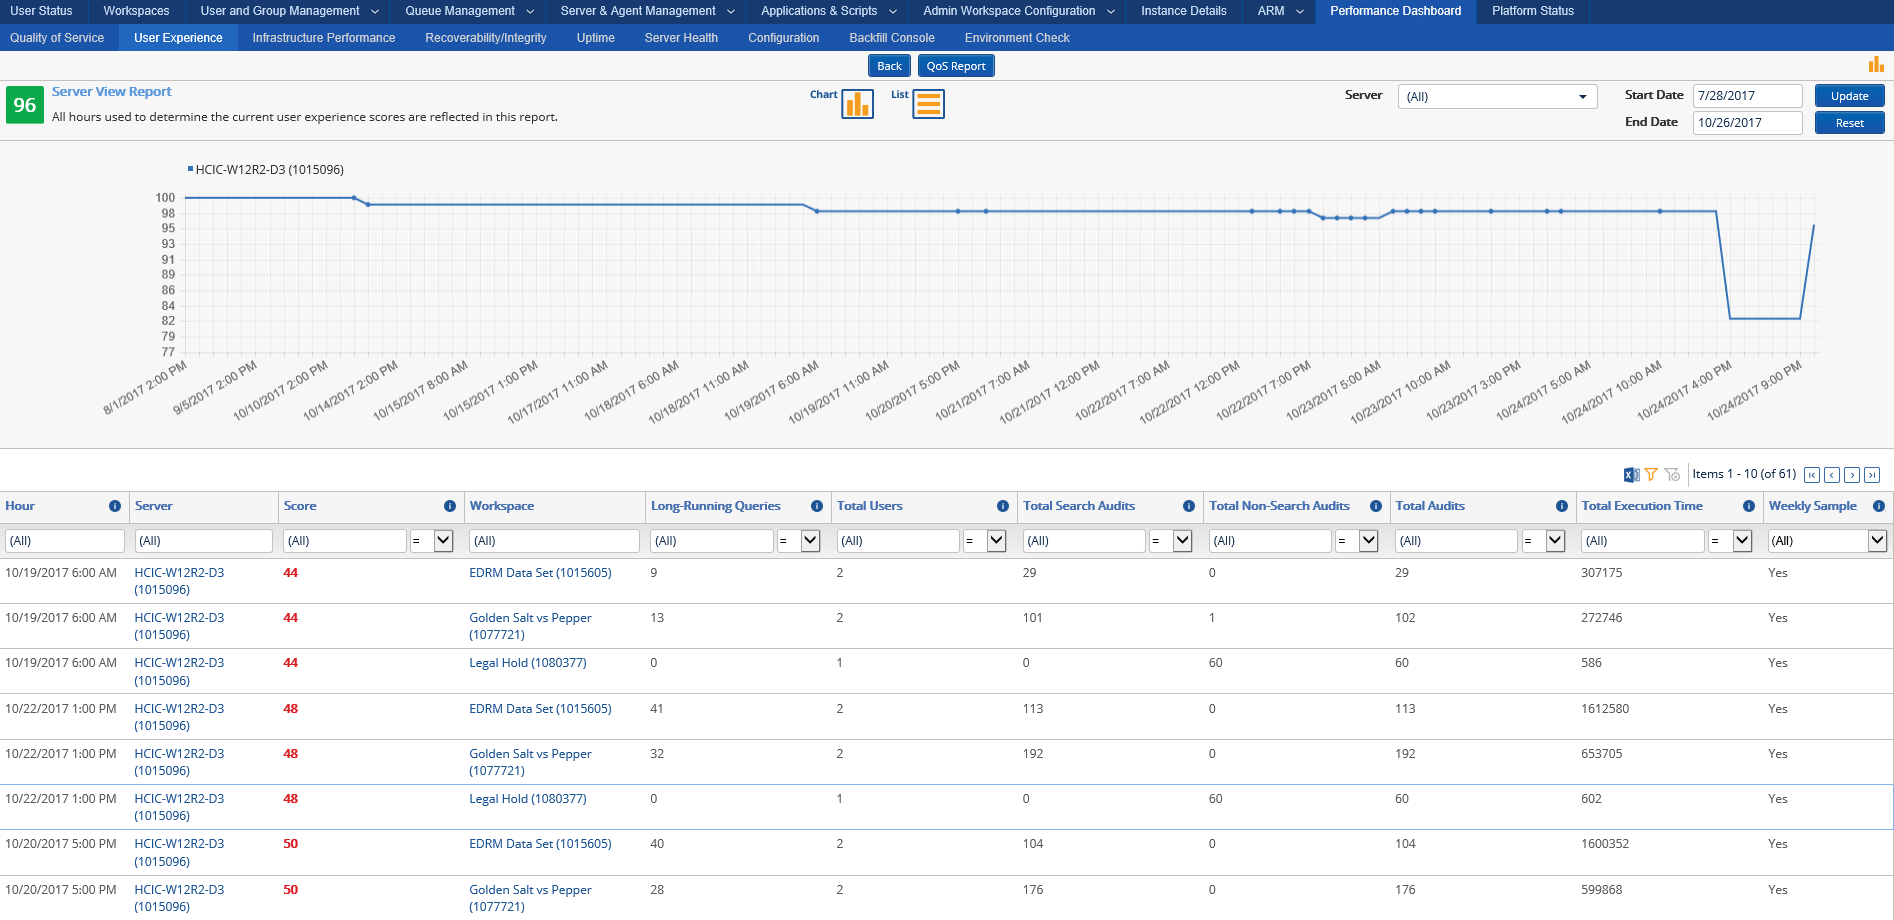
There are more reports for the infrastructure team, but let’s shift gears. What are you users experiencing? What are things like for them? Well go to the User Experience score and look at the User Experience report. Are there long running queries? How many? How many users are experiencing them? What are searches like per workspace? What a great way to see which matters are heating up and may need more attention or moves to that big beast of a SQL Server because you caught the next big case and the docs are flying in:
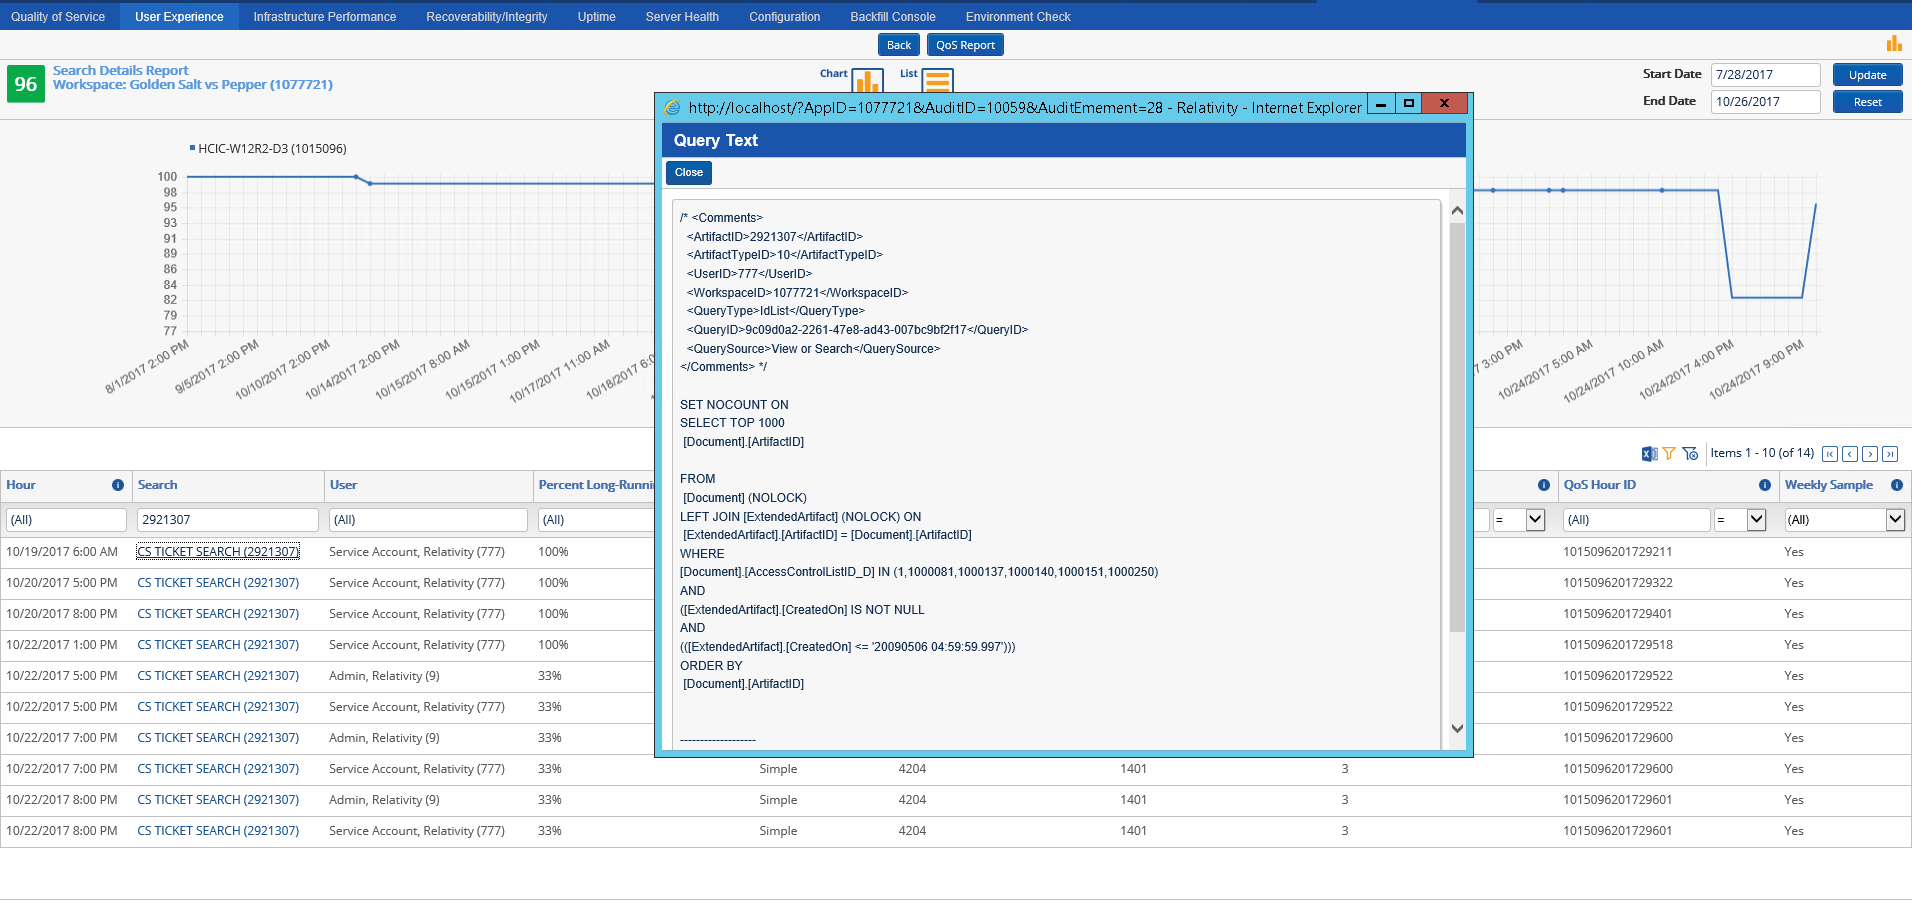
What if you want to see more details? Like “hey why is that search taking so long? What does the query look like?” and maybe get your DBA team or your friendly neighborhood SQL Server consultant to look at the query with you and see if we can add some indexes (or train, or re-train, your users on better searching skills and your workflow teams on better template creation practices, etc)? Well, you can:
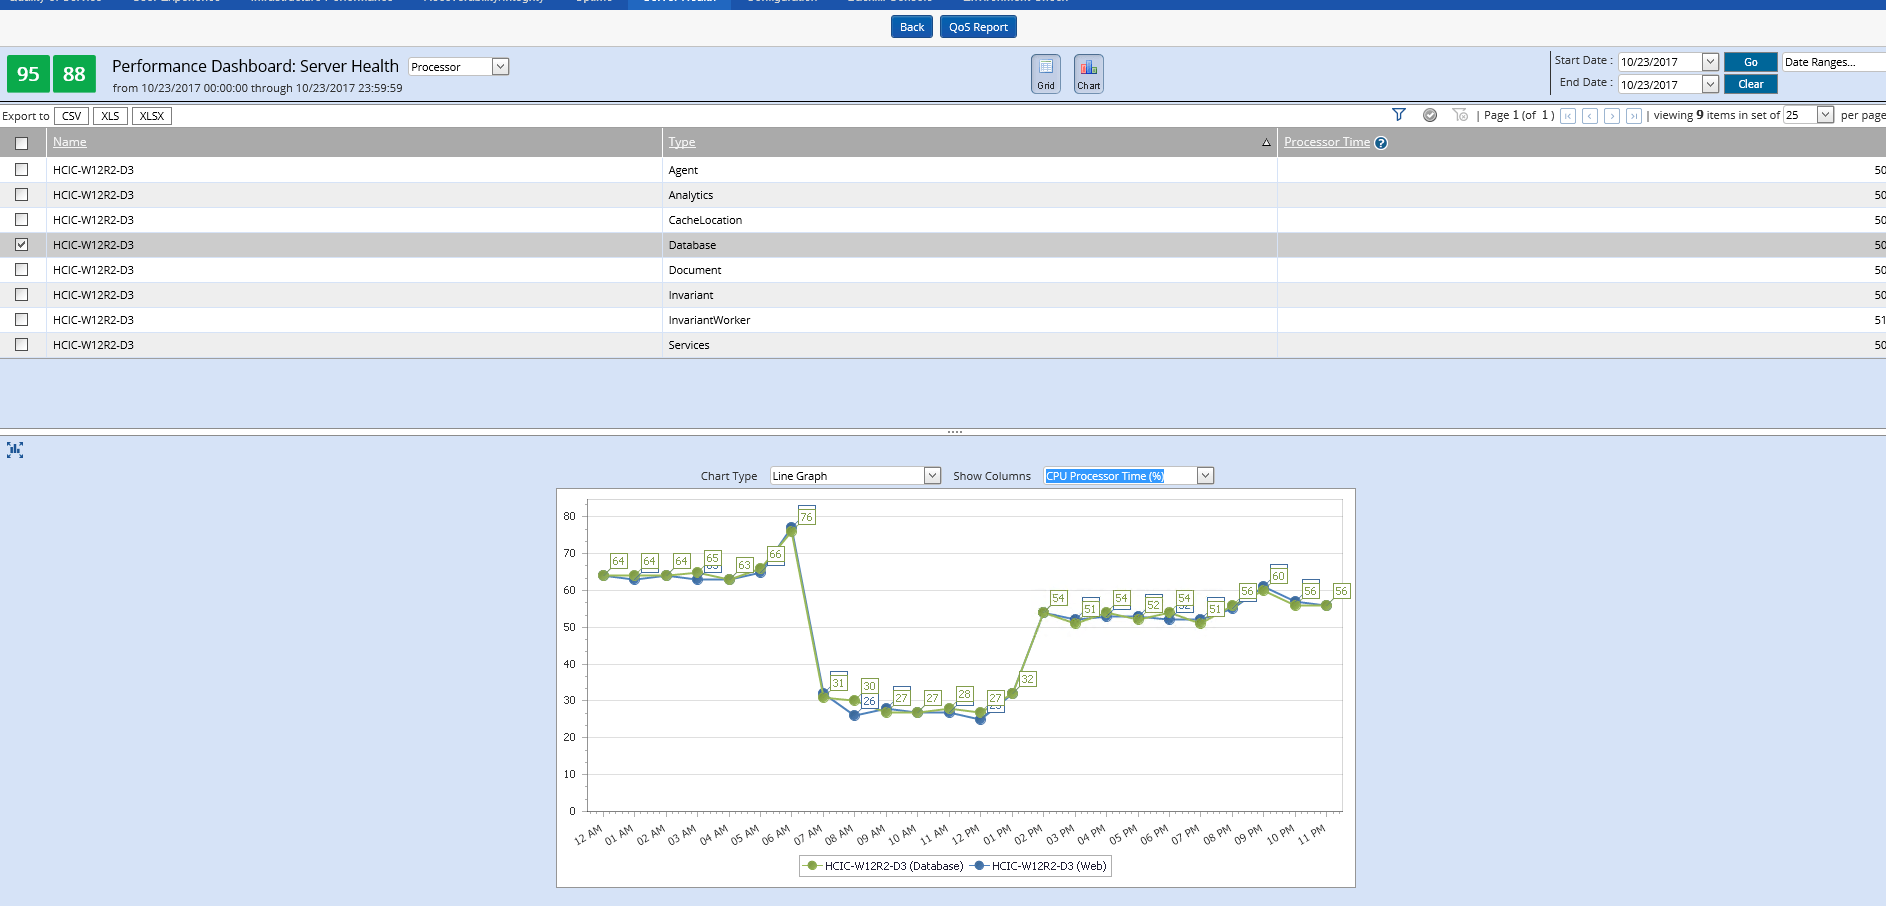
Finally, there are even some performance graphs when you want to look at the server information report and you find a CPU or Memory warning:
The bottom line here? This tool is already there. It’s already built. You already own the license to it. It won’t check all the things Straight Path checks when we do a SQL Server Health Check – but if you installed this, and started looking at the issues, I can guarantee you that you would have fewer issues. Sometimes we have some tough or frustrating calls with new customers who call us directly or even when we act as an escalation point to Relativity in our Relativity practice. I’d say the vast majority of those tough cases wouldn’t’ have happened if someone had a health check or even if they installed PDB and started looking after the warning flags thrown by the tool.
(Special thanks to Jared Lander at Relativity support. He helped get me these screenshots from his lab environment, and I appreciate his time. Also for he and Carlo allowing me to speak alongside them. They are a wealth of information, and it showed in how the audiences dug the presentation. Relativity has a pretty cool support organization, and they build you some great tools. With so many customers in so many industries, I can easily blame the vendor for the issues many customers have. It’s hard to do that here. Yeah, they make their product a bit customizable, but they give the support teams the tools and support they need to make the best of it.)
Go. Install Performance Dashboard. Start Looking. I guarantee you this will decrease your time to discovering the truth and acting on it.